A better model? Low levels of radiation and health effects
One of the more pivotal issues in facilitating the use of radiation sources—including nuclear power—in the United States (and most of the Western world) is concern about the health effects of low levels of radiation. The current regulatory assumption is that every additional increment of radiation linearly increases the risk of cancer.
This view is based on studies of health effects for the survivors of the atomic bombs from Hiroshima and Nagasaki. The Japanese Life Span Study showed that for those survivors who received a relatively large dose of radiation (>0.2 Gray), there is a linear relationship between the dose from the atomic bomb and the likelihood of some types of cancer. However, data from the atomic bomb survivors are not definitive regarding an increase in risk associated with relatively small doses of radiation from background sources or routine occupational exposure.
The linear no-threshold (LNT) model was adopted as a scientifically plausible and conservative model to bound risk to the public and to workers. It posits a linear increase of cancer for all doses above zero. One of the key regulatory principles derived from this model is to keep radiation exposure to workers and the public as low as reasonably achievable (ALARA) without introducing undue cost or other risks. ALARA seemed to be a prudent concept at the time, but “reasonably achievable” has been broadly interpreted since then, leading to some undesirable consequences (such as physical risks from welding shielding in place or additional construction activities to meet postclosure waste site radiation limits, avoidance of medical exposure even when radiation treatment has a lower risk than alternatives such as surgery, unnecessary deaths due to evacuation of the elderly as demonstrated by Fukushima, and so forth).
With low doses of radiation, the predicted increase in the likelihood of cancer is very small. Since cancer has a relatively high incidence (about 1 in 5 deaths is caused by cancer), without any exposure to occupational or medical radiation it is very difficult to detect the relationship between a small amount of radiation exposure and an increased cancer risk. To examine the nature of this relationship, numerous studies evaluated larger populations, 29 of which were recently examined in National Council on Radiation Protection & Measurements (NCRP) Commentary 27 as to whether they supported the LNT model, with varying results.1
Many of the studies cited in NRCP Commentary 27 that did support the LNT model noted that the excess relative risk of cancer per unit dose seemed to be less for low dose rates, indicating that a lower dose rate but with the same total dose resulted in a smaller effect. This is sometimes called the dose rate effectiveness factor (DREF) and can be defined as the ratio of the expected effect to the actual effect. Besides epidemiological studies, several microbiological and animal studies have shown results that seem to contradict the LNT hypothesis as an accurate model of low-dose risk.2–4 Taken as a whole, these studies plus evidence of a DREF effect of greater than 1 indicate that a different mathematical relationship may apply in the low-dose-rate versus high-dose-rate regions.
The current understanding of the process from cancer initiation to cancer formation is that it starts as DNA damage and then goes through several stages that may ultimately result in cancer of the larger organism. These stages include DNA damage, potential DNA repair, potential cell apoptosis, bystander effects that may protect neighboring cells, immune system responses, and finally growth of one cell into enough cells that the cancer is a threat to the larger organism.
There are many environmental insults (ionizing radiation, chemicals, etc.) in addition to natural cellular processes that can cause DNA damage in cells. Damage caused by natural processes includes but is not limited to oxidative damage, replication errors, and meiosis errors.5 DNA damage caused by environmental insults is in most cases indistinguishable from natural processes and would be expected to be repaired by normal cellular processes.4
The normal incidence of cancer indicates a high incidence of DNA damage from causes other than radiation. Although this damage can be affected by lifestyle choices, many people with healthy lifestyles also get cancer. All people experience this damage to some degree. However, the human body has developed mechanisms to repair such damage.4,5 As radiation dose rates increase, these damage repair mechanisms become weakened by radiation-induced damage.4 As the dose rate increases enough that radiation DNA damage significantly exceeds DNA damage from other agents, then the relationship between total dose and cancer likelihood might look more like linearity.
Current alternatives to LNT
Alternative models of cancer risk associated with low dose or dose-rate exposures include the supralinear model, linear-quadratic model, threshold model, and hormesis model.
Some mathematical models have been proposed for hormesis, but the mathematics of cell repair mechanisms are extremely complex and specific to the type of damage and the type of repair mechanism. Their overall relationship to the stages from cancer initiation to cancer formation are likely to be species-specific to some degree. The cost and difficulties of performing research to understand all the variables and all the mechanisms for the damage and repair of human DNA and its relationship to the stages from cancer initiation to cancer formation is overwhelming. A mathematical model of DNA damage and repair in yeast using 10 parameters was created using multiple differential equations for different types of double strand breaks.4 It is hard to see how human carcinogenesis and DNA repair could be modeled accurately without an inordinate amount of research.
Many health physicists have proposed a threshold model and suggested values for such a threshold, but given the fact that any radiation will cause DNA damage, unless it can be shown that this damage is likely to be completely repaired for all individuals, there is some level of risk implied. Alternatively, it is possible that a practical threshold could be developed, but this is a question of how safe is “safe enough,” and that is something that is very difficult to build a societal consensus around from a regulatory standpoint.
Mathematical effect
The microbiology studies cited earlier indicate a strong relationship between dose rate and the permanency of DNA damage. Double strand breaks (DSBs) are believed to be the primary cause of radiation-induced carcinogenesis.5
The multiple repair mechanisms for DSBs have been shown to be progressively impeded at increasing radiation doses/dose rates. DSB damage has been divided into three categories: quickly rejoinable (1–2 hours), slowly rejoinable (several hours), and unrejoinable (>24 hours). Repair rates over a three-day period were reviewed, and it was concluded that unrejoinable DNA damage is not just related to the total dose, but also to dose rate.4
Mathematical modeling of DSB repair mechanisms can be quite complex (as stated above), but a simpler form may serve as an approximate scientific model. Based on the facts that 1) if there is no damage, there is no repair; 2) for a very low damage rate, the repair rate is nearly equal to the damage rate; and 3) for high damage rates the repair rate is greatly inhibited, I propose the following new equation:

Equation 1 represents cellular repair rates, where R is the repair rate (DSBs repaired that preclude fatal cancer repaired per unit time), ER is the damage rate (DSBs that cause fatal cancer created per unit time), and Ld is a normalizing repair rate term (inverse time units). The value of Ld would have to be much higher than ER when ER is in the range resulting from low radiation levels.
At the microscopic level, it might be possible to determine Ld, but it would be specific to the cell type and cancer type, and not necessarily applicable to cancer in humans at the macroscopic level. However, if DSB repair rates are summed for different types of cancer (those that are sensitive to radiation), the overall result would be similar to that resulting from Eq. 1, for example, if there is no damage there is no repair, for low damage rates the repair is equal to the damage rate, and for high damage rates the repair rate is greatly inhibited.
It is important to recognize that Eq. 1 is not intended to describe instantaneous repair rates (e.g., repairs per second) but is intended to capture average repairs over periods from hours to days.
Comparisons of carcinogenesis
Studies of other carcinogenic phenomena, such as smoking, can provide some illumination on the general process of carcinogenesis and repair mechanisms that could stop DNA damage from resulting in cancer.
Table 1. Similarities and Differences Between Smoking and Radiation With Regard to Carcinogenesis
| Characteristic | Smoking | Radiation |
|---|---|---|
| Accuracy of dose | Based on memory of smoker; typically measured in pack-years. | Often precisely known and measured, tenths of mSv to Sv. |
| Range of dose rates actual and studied | Actual smoking rates within 1 order of magnitude. Only large rate studies performed (packs/day). Small rates (e.g., 1 cig/day or 1 cig/month) not studied. | Does rates can vary by several orders of magnitude (mSv/year up to Sv/hour for atomic bomb studies). Rates studied are in mSv/year up to Sv/hour. |
| Types of cancers | Many types but predominantly lung cancer. | Many types. External radiation is not organ specific. Internal radiation can be organ specific, depending on radionuclide. |
| Duration of exposure | Smokers are exposed to smoke continuously until (and if) they stop smoking. Thereafter there is no exposure. | Occupational exposure can occur throughout working life; however, background exposure (natural, radon, medical) occurs in childhood and after retirement. This exposure never stops. |
Table 1 is a comparison of radiation and smoking as carcinogens. There are several differences that make the comparison difficult and limit the usefulness of looking at carcinogenesis from smoking, but there is one difference that is quite important. A smoker can stop smoking, essentially ending the carcinogenic input. Radiation exposure, however, never stops. Even after occupational radiation exposure ends, background radiation and medical radiation exposure continue. Indeed, due to the average age after retirement and the higher degree of health problems as people age, medical exposure probably increases.
Studies of lung cancer risk after cessation of smoking show evidence of repair mechanisms that make a substantial difference in the amount of resulting lung cancer. One study showed that the rate of lung cancer can decrease substantially after smoking cessation; there was about a 12-year “half-life” for decreasing risk (i.e., every 12 years after smoking cessation, the risk of lung cancer is reduced by 50 percent).6
As discussed above, aside from DNA repair, there are other mechanisms that prevent DNA damage from automatically turning into cancer for the larger organism. The decrease in lung cancer risk over time after smoking cessation shows that the sum effect of all the mechanisms that prevent DNA damage from automatically turning into cancer, not just DNA repair, behave in a similar manner.
An analogy
Like thinking of light as waves for some phenomena and particles for others, or like thinking of gas molecules as billiard balls, a useful scientific model for radiation carcinogenesis might be neutron activation.
Neutron activation of metal alloys produces many different radionuclides, but they decay with varying half-lives. For a small reactor (e.g., test reactors, university reactors) that changes power frequently but runs for decades, the activity for each produced radionuclide is dependent on different characteristics of the power history. For very long-lived radionuclides (e.g., carbon-14), the activity is a result of the cumulative neutron fluence (n cm−1 vs. n cm−2 sec−1). This is like the LNT model, where carcinogenesis is related to the cumulative radiation dose. For very short-lived radionuclides (e.g., cobalt-58), activity is a result of average neutron flux (n cm−2 sec−1) in the last year. For radionuclides with an intermediate half-life (e.g., cobalt-60), the activity is dependent on both the neutron flux and the accumulated neutron fluence. The activity of the intermediate half-life nuclide is the difference between the activity of the radionuclide created and the activity of the radionuclide that decays. For radiation carcinogenesis, the potential for cancer is related to the difference between the number of DSBs generated that could potentially turn into cancer and the number of such DSBs that are repaired or otherwise stopped before cancer develops. In other words, DSBs that may result in cancer are created by irradiation, but some are repaired before they can develop into cancer.
The evidence to date is that cancer can develop over a period of years, so radionuclides of intermediate half-life would be the best model.
For a small reactor that changes power frequently but runs for decades, the number of time steps (power level changes) could easily be in the thousands. However, for an intermediate half-life radionuclide such as Co-60, the power history can be simplified by just looking at the calendar average neutron flux each year, which will still result in a relatively accurate estimate of the radionuclide content.
Proposed mathematical model
Below is the equation for the current LNT model:

where C equals the probability of a fatal cancer, DR is the dose rate in sieverts per year, and t is the years of exposure. C can also be thought of as the probability of a DSB resulting in fatal cancer. The value 0.05 would have units of the probability of a DSB resulting in fatal cancer per sievert. As stated above, DNA DSBs are used as a surrogate for estimation of cancer rates.
Based on Eq. 2, the creation rate for DSBs resulting in fatal cancer is dC/dt = 0.05DR.
From Eq. 1, ER, being the incident damage rate, would be equal to 0.05DR, and R in Eq. 1 would be the repair rate. (The repair rate can be thought of as the destruction rate for DSBs resulting in fatal cancer.)
A rate equation (net rate = creation rate − destruction rate) can be written using Eq. 1 and Eq. 2:
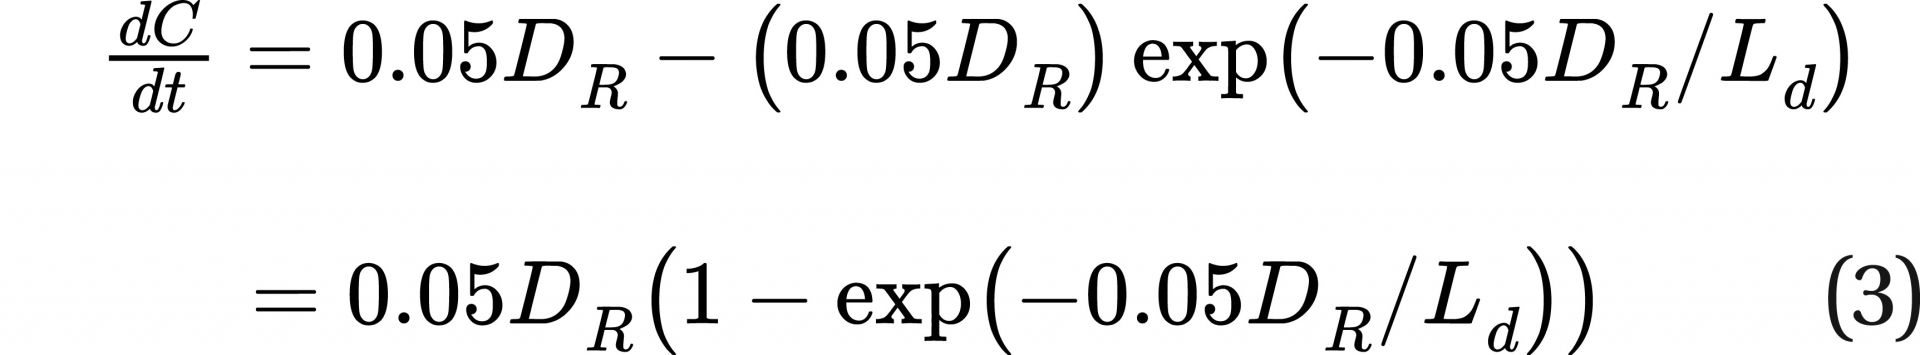
and then integrated to get the equation:

If a new term L is defined such that L = Ld/0.05, where 0.05 is fatal cancers per sievert, making the units of L Sv/hr, the equation can be further simplified to:
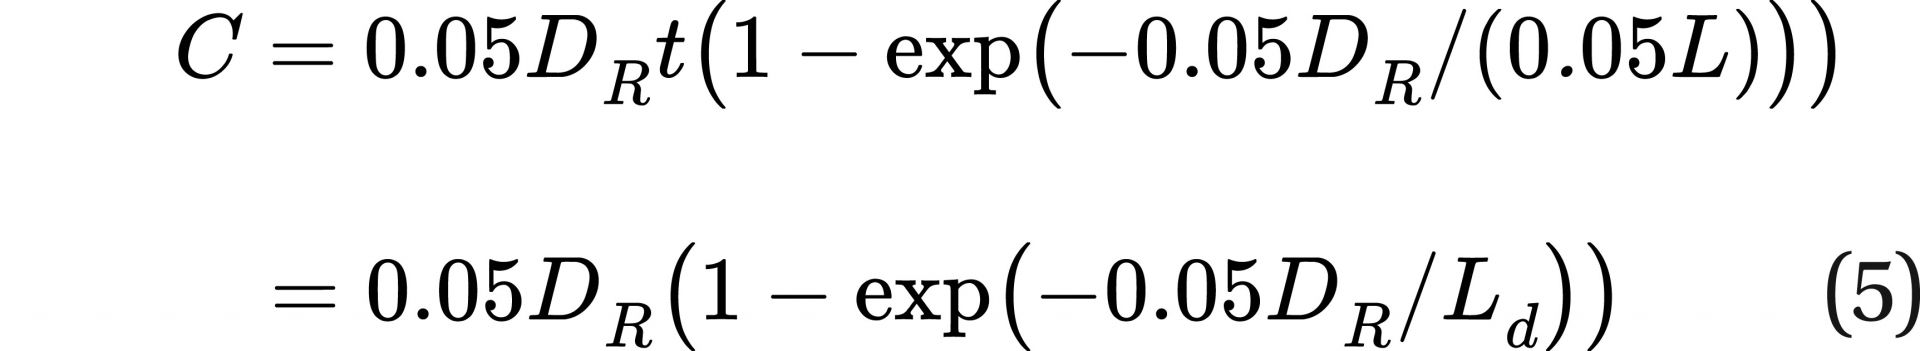
Regarding Eq. 5: first, there is still an incremental increase in fatal cancer probability with each added incremental dose.
Second, when DR >> L, this equation provides the same result as LNT. For the atomic bomb data, DR would satisfy that condition. Third, when DR is low or comparable to L, the fatal cancer risk per sievert is much lower than LNT would imply. This expression of the relationship between fatal cancer probability and dose has three advantages over LNT. First, unlike LNT, this equation has the potential to cover the whole range of dose rates. Second, this mathematical model embodies what the mechanistic cellular studies and smoking cessation studies show, that DSBs are repaired (as well as cancer at the macroscopic level being mitigated) over time for low dose rates.
The third advantage of this equation is its relative simplicity. It accounts for cellular repair mechanisms with a single extra variable.
This mathematical form is not intended to be the last word on assessing cancer incidence. It is intended to be an alternative to LNT that incorporates what we have learned from empirical/epidemiological studies (cell damage and repair mechanisms) and regulatory concerns.
Studies of the DREF could be utilized to estimate L as follows. Combining Eq. 5 and Eq. 2, the DREF would be:
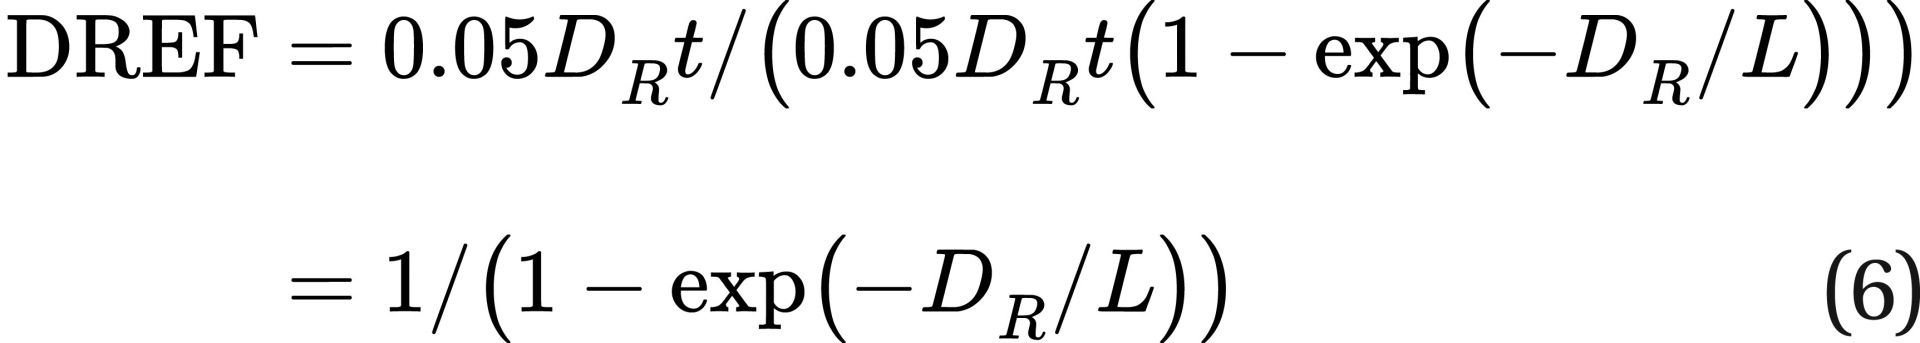
Studies have shown a DREF estimate range from 1 to 3 for solid cancer mortality, however with substantial uncertainty in many of the studies.1 Some studies suggest a much larger range for DREF.7 The Health Physics Society noted in its 2019 position paper (Radiation Risk in Perspective, PS-010-4) that animal, cellular, and molecular studies demonstrate that the responses following low-dose-rate exposure are less than those observed after the same dose delivered at high dose rate. This implies a higher DREF at a lower dose rate, which means that developing an average DREF from data at different dose rates might not be appropriate since the DREF itself is dependent on the dose rate.
Note that Eq. 6 can be rearranged to solve for L:

This equation would allow researchers to use data grouped according to dose rate, along with cancer data at each dose rate to develop a value for L.
The HPS is on record (in the same 2019 position paper) as stating that a dose of less than 100 mSv has no demonstrated statistical effect on cancer incidence. This would imply that the cancer incidence would be very small at 100 mSv. If we assume fatal cancer incidence for an occupational lifetime dose (50 years, or 18,262.5 days) of 100 mSv (a dose rate of 2 mSv/year) is a factor of 10 lower than the LNT model and use the 0.05 fatal cancers/Sv from BEIR VII,8 we can derive a value for L from Eq. 7. The derived value of L would be 5.197 ⨉ 10−5 Sv/day, or 18.98 mSv/year. This is a relatively conservative assumption; some studies indicate no effects at cumulative doses above 100 mSv, depending on dose rate.
Table 2. The Risk of Fatal Cancer Based on the Model in Equation 5
| Dose rate (Sv day−1) | Dose rate (mSv yr−1) | Accumulative dose over 50 years (mSv) | Excess relative risk of fatal cancer | Ratio of ERR with new model vs. LNT risk |
|---|---|---|---|---|
| 1.08 x 10⁻⁷ | 0.04 | 1.97 | 2.05 x 10⁻⁷ | 482 |
| 6.84 x 10⁻⁷ | 0.25 | 12.5 | 8.17 x 10⁻⁶ | 76 |
| 1.0 x 10⁻⁶ | 0.37 | 18.3 | 1.74 x 10⁻⁵ | 52 |
| 2.0 x 10⁻⁶ | 0.73 | 36.5 | 6.89 x 10⁻⁵ | 26 |
| 2.74 x 10⁻⁶ | 1.00 | 50.0 | 1.28 x 10⁻⁴ | 19.5 |
| 4.0 x 10⁻⁶ | 1.46 | 73.0 | 2.70 x 10⁻⁴ | 13.5 |
| 5.48 x 10⁻⁶ | 2.00 | 100 | 5.01 x 10⁻⁴ | 10.0 |
| 7.0 x 10⁻⁶ | 2.56 | 128 | 8.05 x 10⁻⁴ | 7.94 |
| 1.0 x 10⁻⁵ | 3.65 | 182 | 1.60 x 10⁻³ | 5.71 |
| 3.0 x 10⁻⁵ | 10.1 | 541 | 0.0119 | 2.28 |
| 1.0 x 10⁻⁴ | 36.5 | 1,694 | 0.0723 | 1.17 |
| 3.0 x 10⁻⁴ | 110 | 4,304 | 0.215 | 1.00 |
| 0.001 | 365 | 9,546 | 0.477 | 1.00 |
| 0.003 | 1,100 | 14,652 | 0.733 | 1.00 |
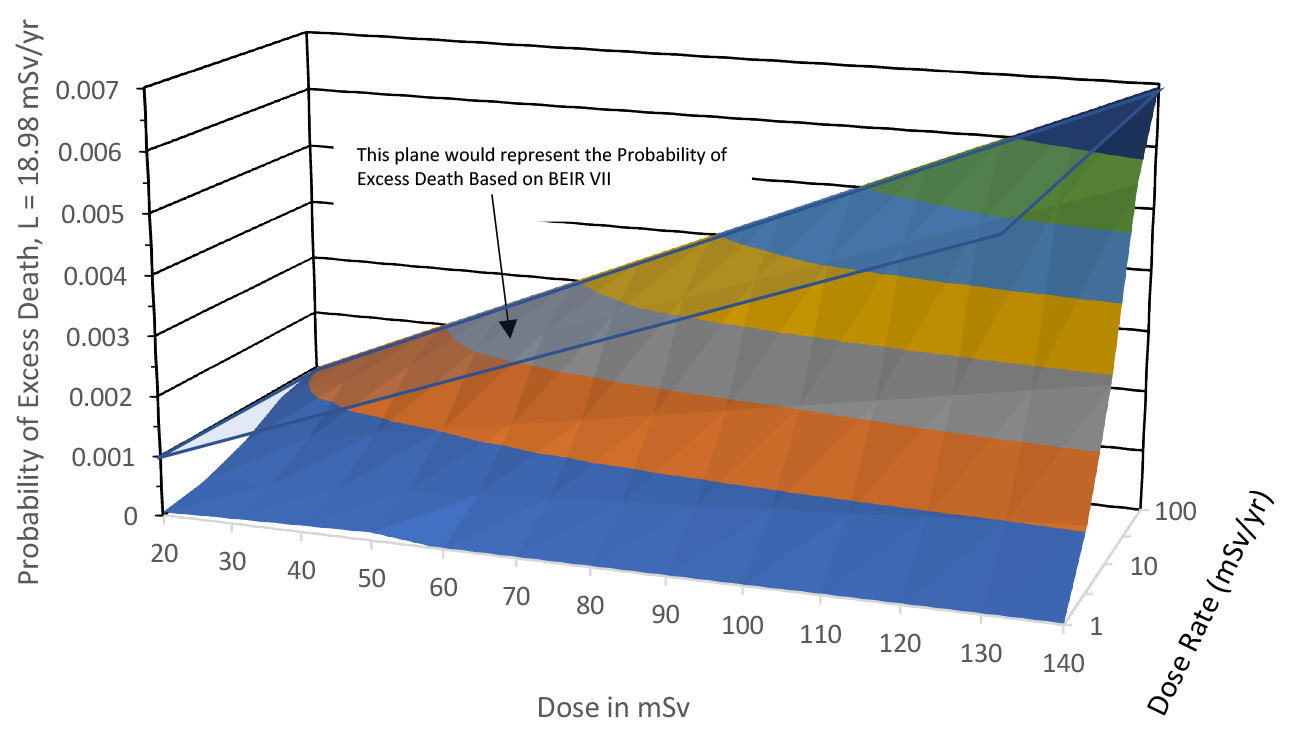
Figure 1. Relation between dose, dose rate, and probability of excess fatal cancer.
Table 2 shows the risk of fatal cancer based on the Eq. 5 model and compares it to risk derived from LNT. Figure 1 shows the relationship between dose, dose rate, and probability of excess death graphically based on the above-derived value of L.
As stated above, this model would still imply some risk for every increment of radiation exposure, but the risk increment at low dose rates would be significantly smaller (even compared to current assumptions), allowing some relaxation of radiation dose limits.
Note that as the dose rate increases in Fig. 1, the relationship between dose and excess cancer asymptotically approaches the BEIR VII model. Figure 1 also shows what the BEIR VII relationship would look like.
Implementation of new model
The proposed Eq. 5 for cancer risk requires knowledge of dose rate as well as dose. While dose is generally recorded accurately, dose rate is generally not recorded. However, as discussed above for neutron activation, given the long time frame in which cancer tends to develop, the dose per year should be adequate. The cumulative risk would then be calculated as follows:

where y represents all years of exposure.
Although dose rate is not typically recorded, dose averaging over yearly periods is a reasonable approach, similar to calendar averaged neutron flux data over yearly periods for calculating intermediate half-life radionuclides.
Advantages and benefits
This model explains why different carcinogens, such as smoking and radiation, can be synergistic, that is, the effect together is greater than the sum of the individual effects.9 When individuals are exposed to two or more carcinogens concurrently, the rate of exposure increases (since the rate would be the summed rates of the two or more carcinogens), so the higher rate makes the combined carcinogens more effective in causing cancer.
This mathematical model also explains why studies of areas with different background radiation levels have failed to show significant difference in cancer incidence.1 In general, background radiation level provides a very low dose rate.
When the current LNT model (see Eq. 2) is used to estimate cancer risk, generally the user is advised to reduce the risk by a factor of 2 for low dose rates. In 2012, the UN Scientific Committee on the Effects of Atomic Radiation (UNSCEAR) defined a “low dose rate” as less than 6 mSv/hr. It’s not always clear when to apply this; it would be applicable for most occupation exposure, but for some high radiation exposures (e.g., steam generator repairs) it may not be. By feathering in the cancer risks from low dose rates and high dose rates into a single equation, this problem is eliminated.
It could be argued that this relatively short article with relatively little detail about radiation effects for individual types of cancer does not justify deviating from the LNT model. I do not disagree that the above treatment is far from exhaustive. However, I also note that ignoring all DNA repair mechanisms (except for a vaguely defined factor of 2) is not a scientific approach. Surely, we can do better (from a mathematical standpoint) than throwing in a factor of 2 at the endpoint. Science is supposed to explain not just why things happen but provide a reasonable mathematical relationship between inputs and outputs.
Frank Augustine is a retired engineer from the Naval Nuclear Laboratory. This article is the opinion of the author and does not necessarily reflect the opinions of the American Nuclear Society, the Naval Nuclear Propulsion Program, the Naval Nuclear Laboratory, the Department of Energy, or the National Nuclear Security Administration’s Naval Reactors Office. Publication of author viewpoints or identification of materials or products should not be construed as endorsement by this publication or the Society.
References
- R. E. Shore et al. “Recent Epidemiological Studies and the Linear No-Threshold Model for Radiation Protection—Considerations Regarding NCRP Commentary 27.” Health Phys 116 (2019):235; doi.org/10.1097/HP.0000000000001015.
- W. M. Glines. “Mechanistic Biology and Radiation Standards.” Health Phys 118 (2020):257; doi.org/10.1097/HP.0000000000001188.
- O. G. Raabe. “Concerning the Health Effects of Internally Deposited Radionuclides.” Health Phys 98 (2010):513; doi.org/10.1097/HP.0b013e3181c20e25.
- I. Shuryak. “Mechanistic Modeling of Dose and Dose Rate Dependences of Radiation-Induced DNA Double Strand Break Rejoining Kinetics in Saccharomyces cerevisiae.” PLoS ONE 11(2016):e014607; doi.org/10.1371/journal.pone.0146407.
- W. Han and K. N. Yu. “Ionizing Radiation, DNA Double Strand Break and Mutation.” Chap. 7 in Advances in Genetics Research, Vol. 4, ed. K. V. Urbano (Nova Science Publishers, 2010).
- H. A. Tindle et al. “Lifetime Smoking History and Risk of Lung Cancer: Results from the Framingham Heart Study.” J National Cancer Institute 110(2018):1201; doi.org/10.1093/jnci/djy041.
- L. T. Dauer et al. “Review and Evaluation of Updated Research on the Health Effects Associated with Low-Dose Ionising Radiation.” Rad Prot Dosim 140(2010):103; doi.org/10.1093/rpd/ncq141.
- National Academies. “BEIR VII: Health Risks from Exposure to Low Levels of Ionizing Radiation” (2006); nap.nationalacademies.org/resource/11340/beir_vii_final.pdf.
- K. Furukawa et al. “Radiation and Smoking Effects on Lung Cancer Incidence Among Atomic Bomb Survivors.” Rad Res 174(2010):72; doi.org/10.1667/RR2083.1.