U.S. nuclear capacity factors: Stability and energy dominance
May 2, 2025, 2:57PMNuclear News
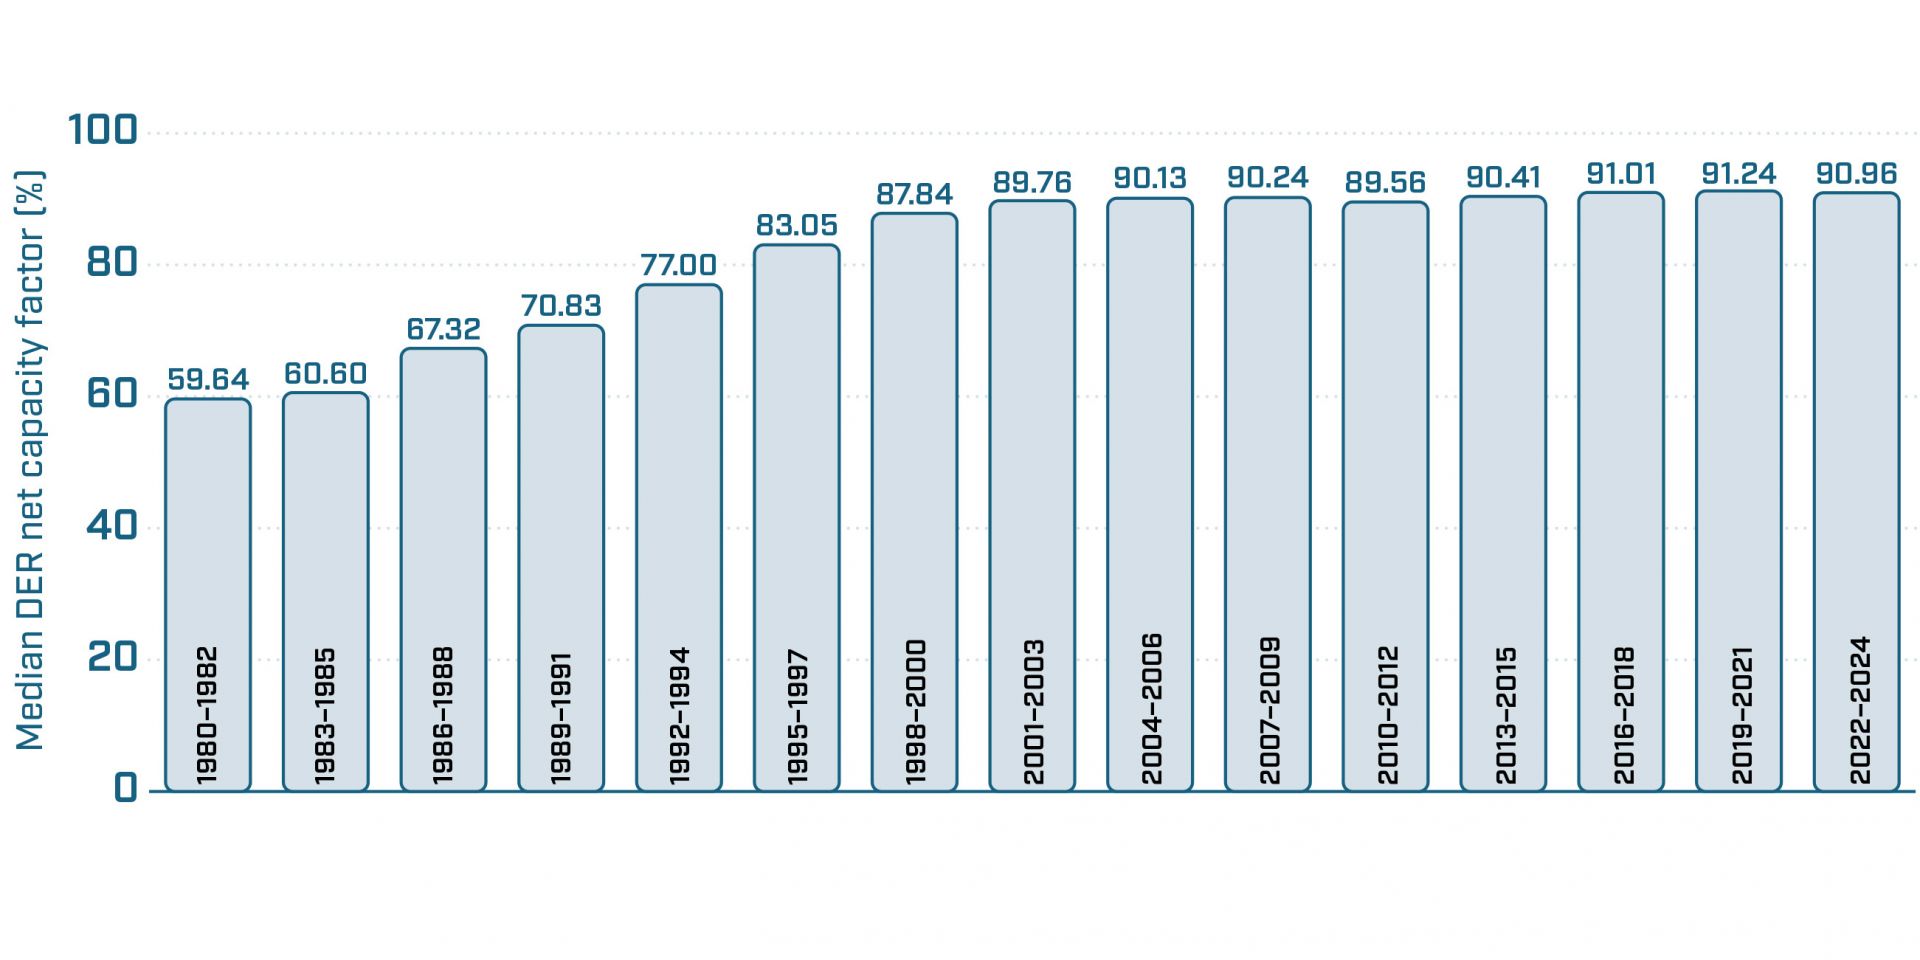
Fig. 1. Median capacity factor of all reactors. The median DER net capacity factor of the 92 reactors included in this survey for the three-year period 2022–2024 is 90.96 percent. The 92 reactors in this survey are being compared with 94 reactors in 2019–2021 (when Indian Point-3 and Palisades were also included); 98 in 2016–2018; 99 in 2013–2015. There were 104 reactors in the five three-year periods prior to that. There were 53 reactors in the database in 1980–1982, and in the five subsequent periods there were 60, 77, 97, 102, and 103.
Nuclear generation has inertia. Massive spinning turbines keep electricity flowing during grid disturbances. But nuclear generation also has a kind of inertia that isn’t governed by the laws of motion.
Starting—and then finishing—a power reactor construction project requires significant upfront effort and money, but once built a reactor can run for decades. Capacity factors of U.S. reactors have remained near 90 percent since the turn of the century, but it took more than a decade of improvements to reach that steady state. The payoff for nuclear investments is long-term and reliable.
To continue reading, log in or create a free account!