
Nuclear Fuel Performance Life Cycle Modeling with the End in Mind
Decades of fuel performance data coupled with advanced analytics and multi-processor computing have enabled the development of ‘novel’ modeling & simulation tools that allow nuclear fuel engineers to predict behavior across the entire fuel cycle. With this new capability nuclear fuel designers and fuel reload managers are better equipped to predict performance and reliability. These tools are fundamental to communicating highfidelity safety margin assessments with the regulator, and, when applied in the early stage of reactor design, can achieve optimum safety system functionality. At the apex of the fuel performance codes development pyramid sit a triad of codes: SI’s Pegasus, DOE’s Bison, and CEA’s Alcyone, which share the commonality of three-dimensional modeling and simulation of nuclear fuel performance. Unique among the capabilities represented by these codes is the ability to bridge the encoded-technology gap between the frontend and the backend of the fuel cycle to eliminate sources of uncertainties in spent fuel safety evaluations. This capability is a distinguishing feature of the Pegasus code.
In performing safety evaluations of spent fuel to comply with 10 CFR Parts 71 and 72 requirements, analysts use structural analysis codes with assumed fuel and cladding properties that neither faithfully represent front-end damage mechanisms nor simulate dry-storage phenomena. This has led to the state of uncertainty that currently exists in resolving spent fuel issues from a regulatory perspective. Resolution of those issues through testing is impractical; the alternative is to rely on modeling and simulation, thereby shifting the uncertainty question to the veracity of analysis codes. This question is uniquely answered by Pegasus.
LWR Applications: Pegasus, as a total-fuel-cycle-simulator, treats, with equal high fidelity, the modeling of fuel behavior in a seamless transition from the active fuel cycle to backend cycle using a single, multi-dimensional finite element model. This first-of-a-kind high-fidelity approach results in enormous savings in engineering cost and work force utilization. The model construct is illustrated in Figure 1, which depicts a full-length fuel rod as a composition of several finite element mesh zones, each of which is suited for simulating a behavior regime in the fuel cycle, with high-fidelity treatment of their interfaces: Zone A is a 2D axisymmetric smeared-pellets representation that is suited for global behavior calculation; Zone B is a 3D fine grid of smeared pellets intended for spent fuel bending and pinch loading analysis; and Zone C is highly detailed fine grid 3D representation of individual pellets intended to simulate the PCI phenomenon including MPS. The dimensions of these zones are parametrized so that they can be easily changed to make the finite-element mesh compatible with the axial power profile (i.e., by placing Zone C at the peak power location).
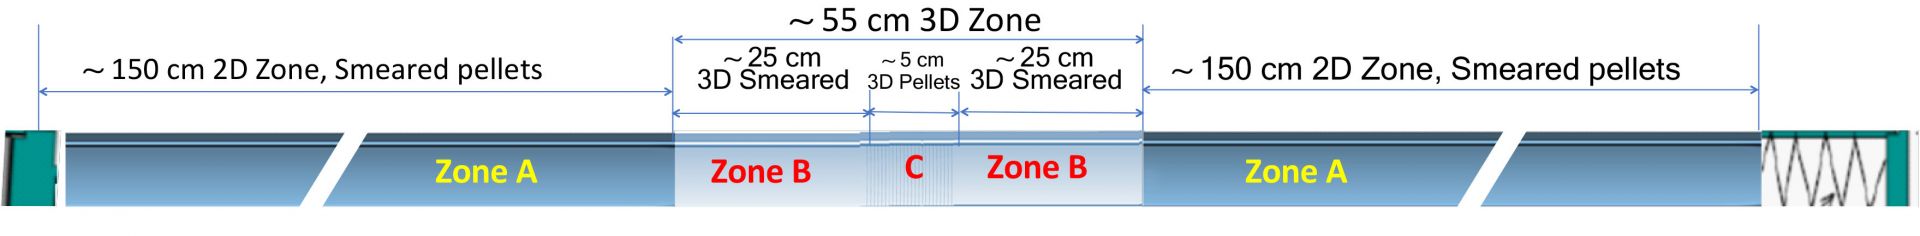
Figure 1. Schematic of Fuel Rod Model for Fuel Cycle Analysis
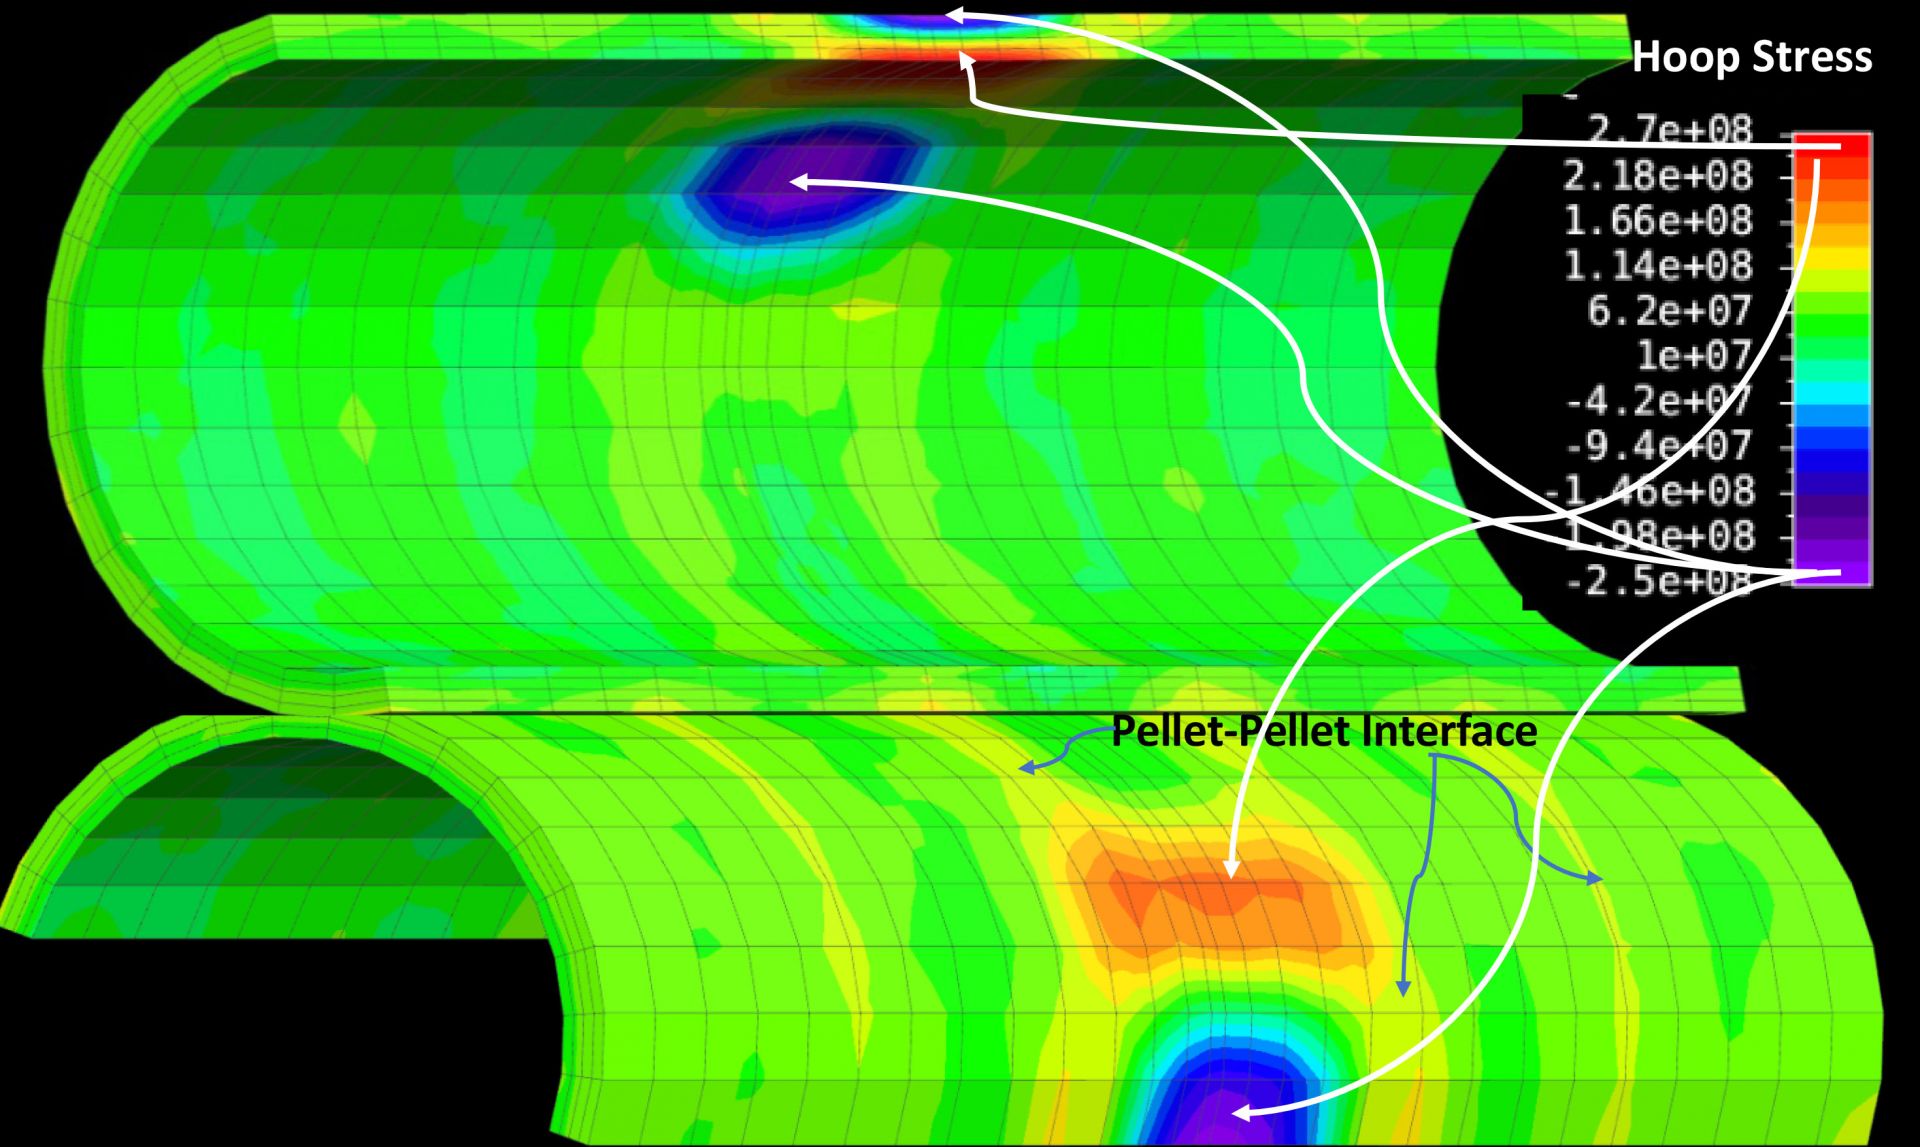
The fuel rod finite element constructs, which are invisible in the Figure 1 schematic, constitute the only geometric input utilized for fuel behavior analysis inreactor as well as spent fuel storage and transportation. The following figures are illustrative examples of the code capabilities, with the obvious qualification that there are many details that could not be presented because of space limitations: Figure 2 shows the temperature distribution for all fuel rod zones at 35 kW/m power level. Note that Zone A, being axisymmetric, appears only in one quadrant. Zone C has a middle pellet with MPS and a radial crack, as shown in Figure 3, which also shows the cladding hoop stress exhibiting severe bending. Figure 4 shows the hoop stress distribution for the cladding Inner and outer surfaces. Figure 5 shows the results of a bending analysis of the fuel rod segment Zone B that could result from the regulatory hypothetical 9-m drop of a spent fuel cask.

Figure 2. Temperature distribution
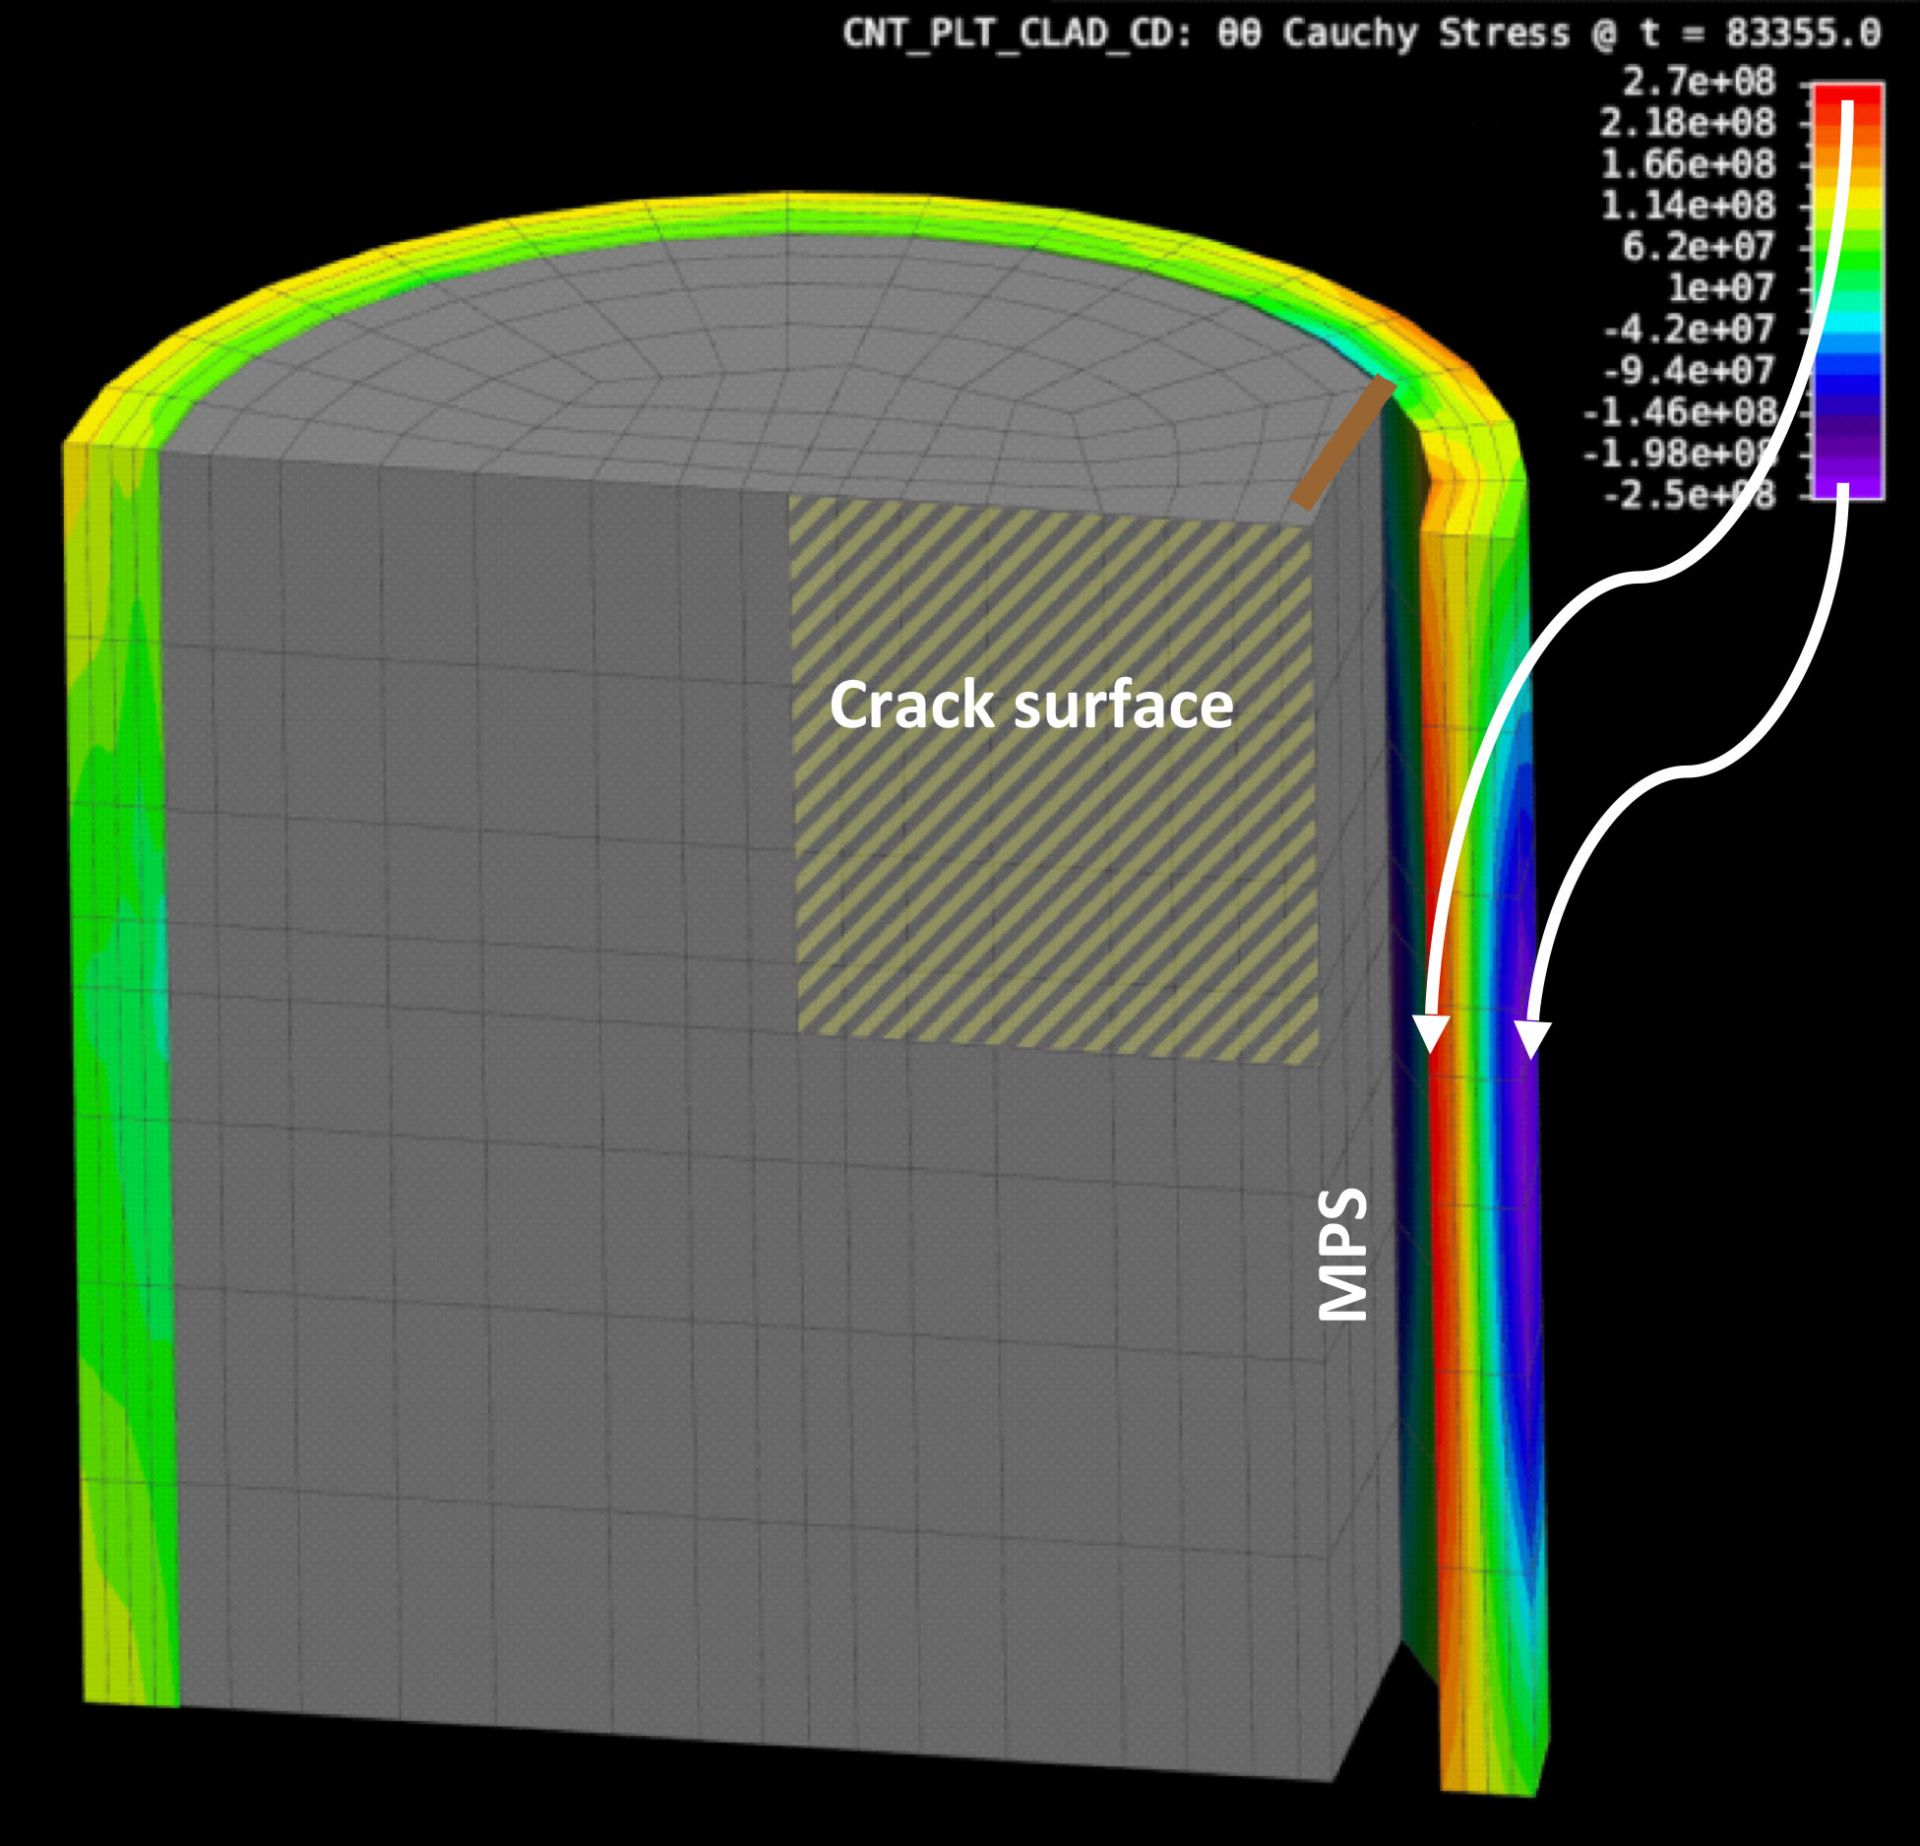
Figure 3. Pellet showing missing pellet surface (MPS) and a radial crack

Figure 4. cladding hoop stress distribution at cladding surfaces
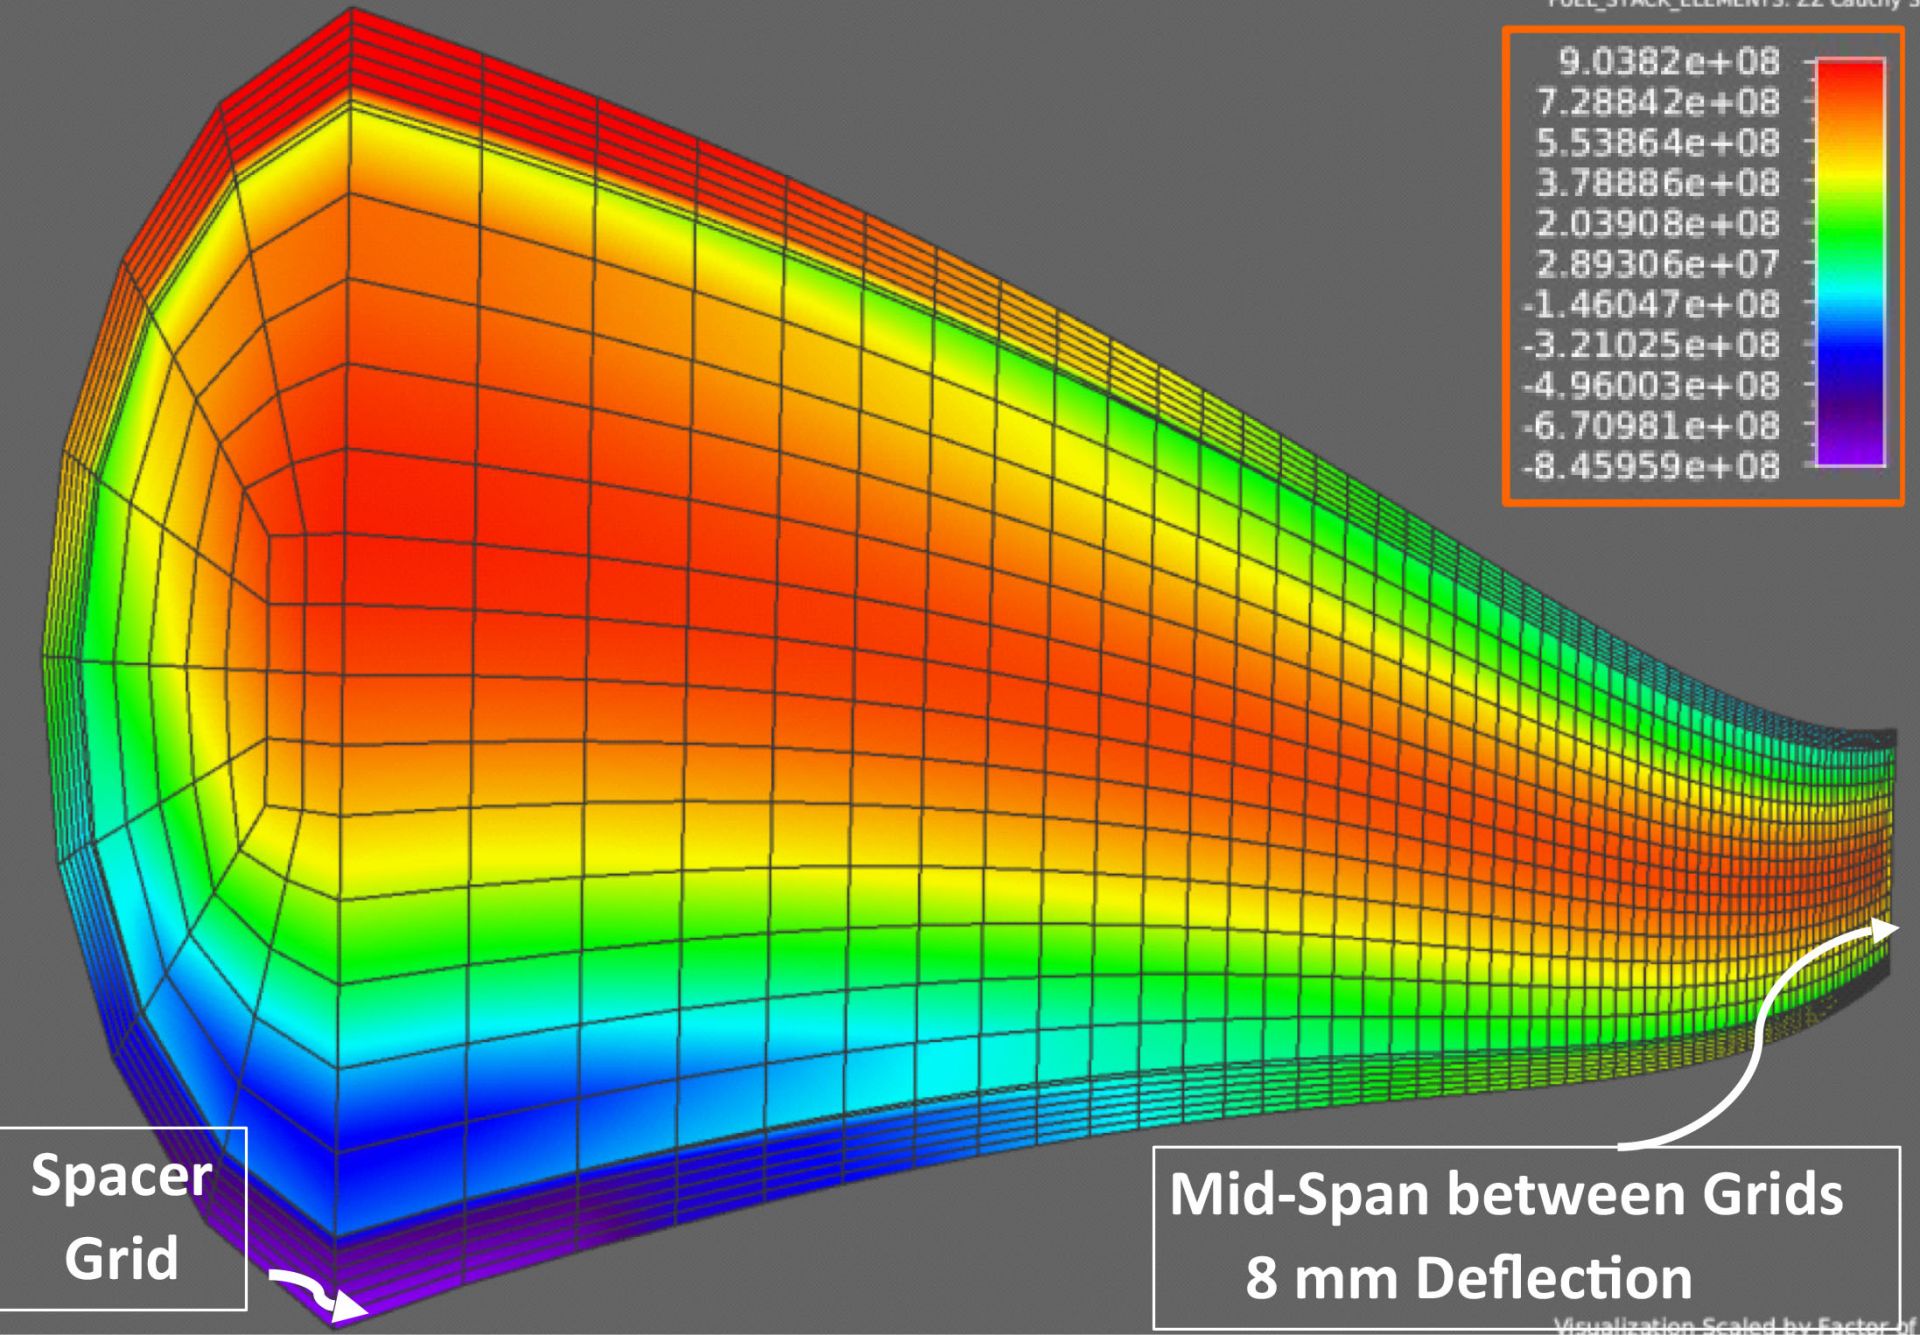
Figure 5. Spent fuel rod segment under bending during 9-m drop
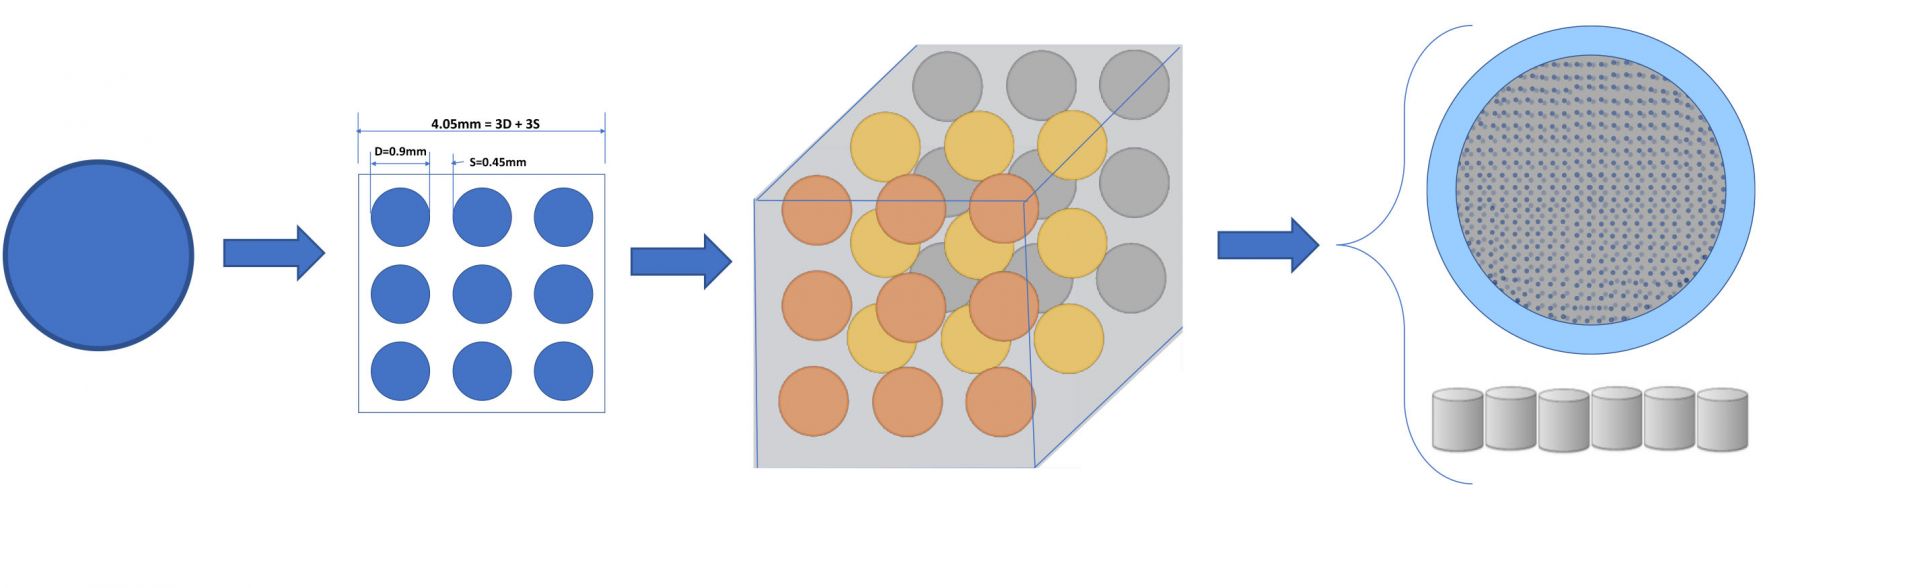
Figure 6
Advanced Reactor Applications: For advanced reactors, Pegasus is extensible to advanced fuel forms such as TRISO, metal, and SiC-based fuel designs. TRISO is treated in a modeling hierarchy shown in Figure 6, starting from a single TRISO in an infinite medium of carbonaceous material. This is generalized to a 2D diametral plane of 3x3 particles, from which a 3D cube of 3x3x3 particles is constructed as a sub-model embedded in a graphite or SiC matrix. Hundreds of such sub-models are then smeared, using mixture theory, into a pebble or a cylindrical pellet containing thousands of TRISOs. This scheme is applied to both the thermal and the mechanical behavior regimes.
For more information contact 1-877-4SI-POWER or visit www.structint.com/pegasus