-3 2x1.jpg)
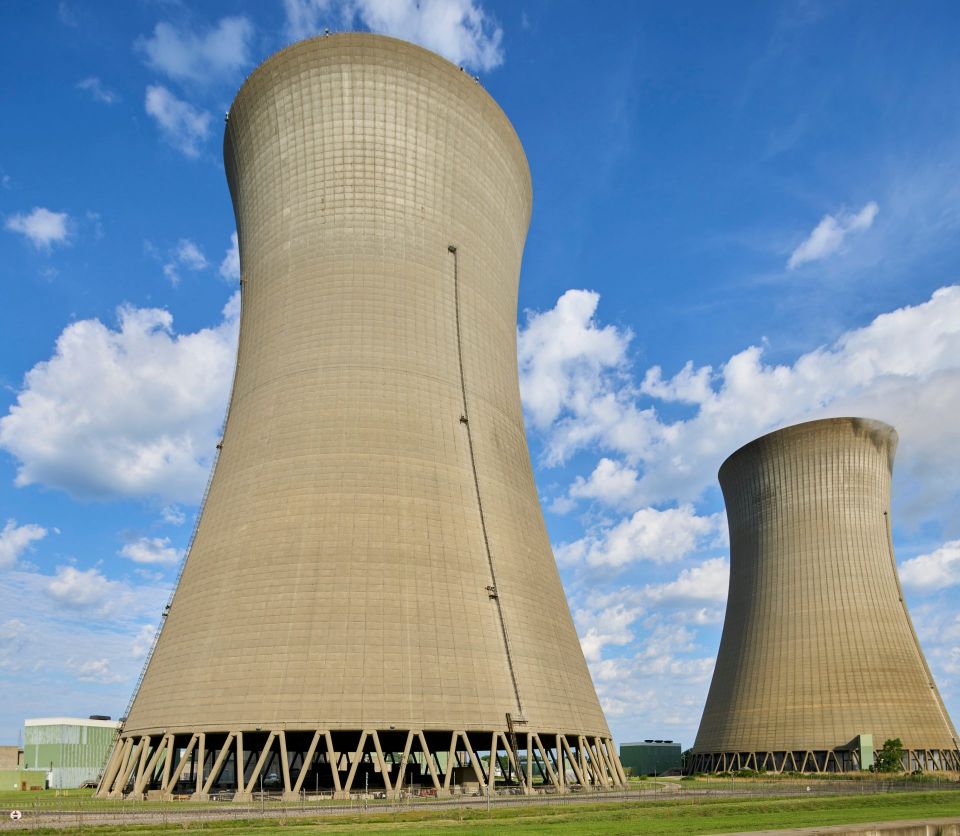
U.S. nuclear capacity factors: Stability and energy dominance
Nuclear generation has inertia. Massive spinning turbines keep electricity flowing during grid disturbances. But nuclear generation also has a kind of inertia that isn’t governed by the laws of motion.
Starting—and then finishing—a power reactor construction project requires significant upfront effort and money, but once built a reactor can run for decades. Capacity factors of U.S. reactors have remained near 90 percent since the turn of the century, but it took more than a decade of improvements to reach that steady state. The payoff for nuclear investments is long-term and reliable.
Whether it’s framed as energy dominance or abundance, building more high–capacity factor baseload generation is a pragmatic move. Electricity demand is up. Nuclear power is recognized as clean energy. Congress has legislated regulatory reforms and appropriated funds for nuclear power demonstrations, technology-neutral investment and production tax credits, and the nuclear fuel supply chain.
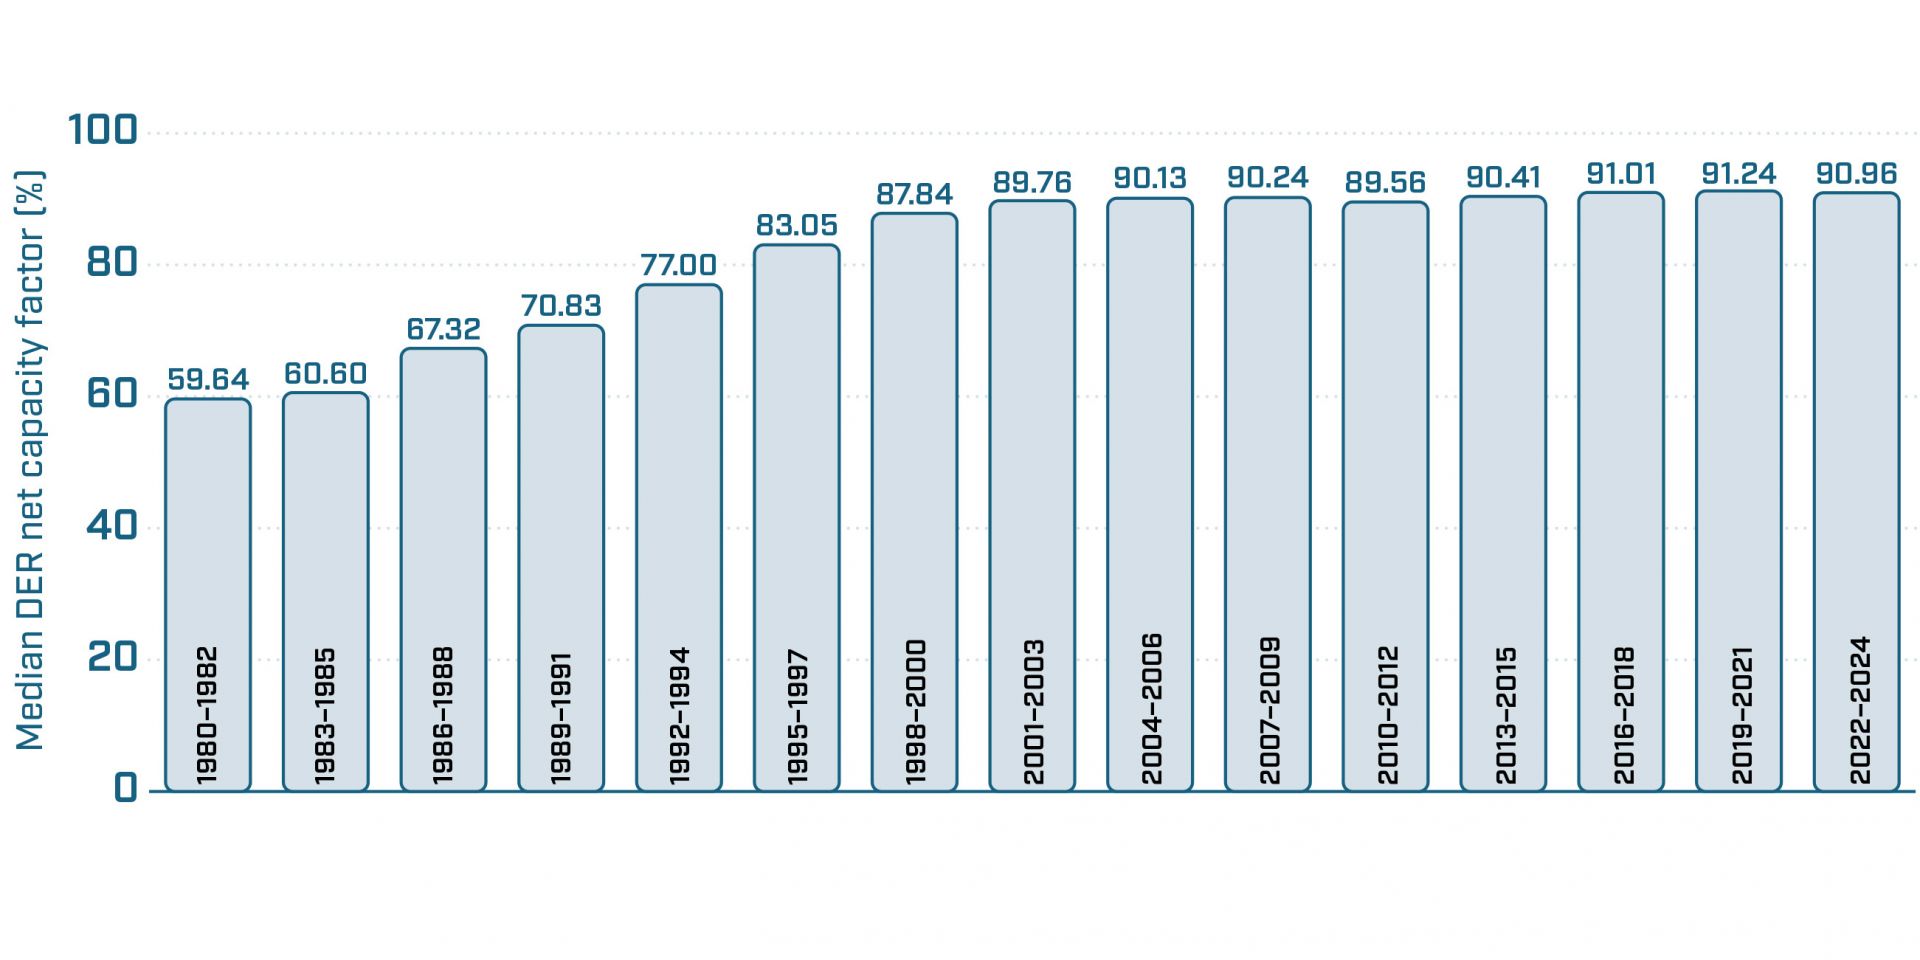
The last quarter-century of high capacity factors has customers and utilities wanting more of the same and getting it, too, through license renewals and power uprates. The domestic fleet’s median design electrical rating (DER) net capacity factor, calculated over three years of generation, is 90.96, just off the mark but keeping pace with the 91.24 median recorded in 2019–2022 (see Fig. 1). The fleet is producing more electricity from 94 reactors today than it did from 104 in the early 2000s.
Yet over the same quarter-century, nuclear energy’s share of U.S. utility-scale electricity production has fallen—from 19.8 percent in 2000 to 18.2 percent in 2024, according to U.S. Energy Information Administration data. While a few projects are progressing, investors have a new reason for decision inertia at this writing, after President Trump’s global tariffs triggered fears that prolonged uncertainty in financial markets could dampen demand and disrupt goals for supply-chain growth.
Good by all accounts
U.S. nuclear generation rose slightly in 2024—to about 782 terawatt-hours, up from 775 TWh in 2023, according to EIA data. Credit goes in part to the 11 reactors that generated more electricity in calendar year 2024 than ever before: Brunswick-2, Clinton, Columbia, Farley-2, Hatch-2, Oconee-2, Palo Verde-1, Point Beach-1, River Bend, Turkey Point-4, and Watts Bar-2. (That’s not counting Vogtle-3 and -4, which didn’t have to stretch to post “personal bests” in their second and first years of operation, respectively. They did, however, contribute to the generation totals above.)
The fleet is ranked (see Table 1) on the basis of each reactor’s actual and potential electricity production, using DER as the measure of capacity, or potential production. Fewer generating hours—whether due to refueling, a reactor scram, or grid or weather conditions—means a lower capacity factor. Nuclear News uses three-year factors to dilute the impact a planned refueling outage can have on a one-year capacity factor.
Table 1. 2022–2024 DER net capacity factors of individual reactors
| Rank | Reactor | Rating* | Type | Owner | Factor |
|---|---|---|---|---|---|
| 1. | Calvert Cliffs-1 | 845 | PWR | Constellation | 101.34 |
| 2. | Dresden-2 | 894 | BWR | Constellation | 99.70 |
| 3. | Calvert Cliffs-2 | 845 | PWR | Constellation | 98.87 |
| 4. | Farley-2 | 855 | PWR | Southern | 97.98 |
| 5. | Dresden-3 | 879 | BWR | Constellation | 97.23 |
| 6. | FitzPatrick | 816 | BWR | Constellation | 96.71 |
| 7. | Peach Bottom-3 | 1331 | BWR | Constellation | 96.47 |
| 8. | Clinton | 1062 | BWR | Constellation | 96.30 |
| 9. | Turkey Point-4 | 844 | PWR | NextEra | 95.65 |
| 10. | Oconee-1 | 865 | PWR | Duke | 95.63 |
| 11. | South Texas-1 | 1250.6 | PWR | STPNOC | 95.56 |
| 12. | Browns Ferry-2 | 1254.7 | BWR | TVA | 95.53 |
| 13. | Oconee-2 | 872 | PWR | Duke | 95.48 |
| 14. | South Texas-2 | 1250.6 | PWR | STPNOC | 95.26 |
| 15. | Turkey Point-3 | 844 | PWR | NextEra | 95.23 |
| 16. | LaSalle-2 | 1178 | BWR | Constellation | 94.91 |
| 17. | Nine Mile Point-1 | 613 | BWR | Constellation | 94.78 |
| 18. | Vogtle-2 | 1169 | PWR | Southern | 94.28 |
| 19. | Ginna | 585 | PWR | Constellation | 94.12 |
| 20. | Vogtle-1 | 1169 | PWR | Southern | 93.82 |
| 21. | Byron-1 | 1213 | PWR | Constellation | 93.73 |
| 22. | Byron-2 | 1186.4 | PWR | Constellation | 93.41 |
| 23. | Point Beach-2 | 615 | PWR | NextEra | 93.34 |
| 24. | Quad Cities-1 | 963.99 | BWR | Constellation | 93.31 |
| 25. | LaSalle-1 | 1178 | BWR | Constellation | 92.82 |
| 26. | Peach Bottom-2 | 1330 | BWR | Constellation | 92.75 |
| 27. | Hatch-2 | 908 | BWR | Southern | 92.70 |
| 28. | Farley-1 | 854 | PWR | Southern | 92.64 |
| 29. | Limerick-2 | 1205 | BWR | Constellation | 92.50 |
| 30. | Salem-1 | 1169 | PWR | PSEG | 92.48 |
| 31. | Oconee-3 | 881 | PWR | Duke | 92.39 |
| 32. | Harris | 992 | PWR | Duke | 92.39 |
| 33. | McGuire-2 | 1187 | PWR | Duke | 92.21 |
| 34. | Summer | 972.7 | PWR | Dominion | 91.96 |
| 35. | Comanche Peak-1 | 1218 | PWR | Vistra | 91.96 |
| 36. | Comanche Peak-2 | 1207 | PWR | Vistra | 91.96 |
| 37. | Palo Verde-1 | 1333 | PWR | APS | 91.86 |
| 38. | Seabrook | 1248 | PWR | NextEra | 91.79 |
| 39. | Monticello | 656.3 | BWR | Xcel | 91.70 |
| 40. | Point Beach-1 | 615 | PWR | NextEra | 91.67 |
| 41. | North Anna-1 | 973 | PWR | Dominion | 91.60 |
| 42. | Palo Verde-3 | 1334 | PWR | APS | 91.49 |
| 43. | Columbia | 1174 | BWR | Energy Northwest | 91.49 |
| 44. | Davis-Besse | 908 | PWR | Vistra | 91.44 |
| 45. | McGuire-1 | 1199 | PWR | Duke | 91.35 |
| 46. | Brunswick-2 | 980 | BWR | Duke | 91.19 |
| Rank | Reactor | Rating* | Type | Owner | Factor |
|---|---|---|---|---|---|
| 47. | Braidwood-1 | 1268 | PWR | Constellation | 90.73 |
| 48. | Nine Mile Point-2 | 1299.9 | BWR | Constellation | 90.48 |
| 49. | Braidwood-2 | 1241 | PWR | Constellation | 90.29 |
| 50. | Wolf Creek | 1200 | PWR | Wolf Creek | 90.27 |
| 51. | Catawba-2 | 1180 | PWR | Duke | 90.16 |
| 52. | ANO-2 | 1032 | PWR | Entergy | 90.08 |
| 53. | Watts Bar-1 | 1173 | PWR | TVA | 90.05 |
| 54. | Diablo Canyon-1 | 1138 | PWR | PG&E | 90.02 |
| 55. | Salem-2 | 1181 | PWR | PSEG | 89.93 |
| 56. | Palo Verde-2 | 1336 | PWR | APS | 89.74 |
| 57. | Browns Ferry-1 | 1254.7 | BWR | TVA | 89.67 |
| 58. | Susquehanna-2 | 1287 | BWR | Talen Energy | 89.60 |
| 59. | Brunswick-1 | 983 | BWR | Duke | 89.59 |
| 60. | Hatch-1 | 885 | BWR | Southern | 89.49 |
| 61. | Limerick-1 | 1205 | BWR | Constellation | 89.29 |
| 62. | Surry-2 | 874 | PWR | Dominion | 89.23 |
| 63. | Watts Bar-2 | 1129 | PWR | TVA | 89.19 |
| 64. | Diablo Canyon-2 | 1151 | PWR | PG&E | 88.83 |
| 65. | Cook-2 | 1212 | PWR | AEP | 88.79 |
| 66. | Callaway | 1228 | PWR | Ameren | 88.56 |
| 67. | Susquehanna-1 | 1287 | BWR | Talen Energy | 88.55 |
| 68. | North Anna-2 | 973 | PWR | Dominion | 88.36 |
| 69. | Quad Cities-2 | 957.3 | BWR | Constellation | 88.11 |
| 70. | Beaver Valley-2 | 960 | PWR | Vistra | 88.11 |
| 71. | Surry-1 | 874 | PWR | Dominion | 87.73 |
| 72. | Cook-1 | 1084 | PWR | AEP | 87.64 |
| 73. | Perry | 1268 | BWR | Vistra | 87.37 |
| 74. | ANO-1 | 850 | PWR | Entergy | 87.14 |
| 75. | Sequoyah-1 | 1184.37 | PWR | TVA | 87.06 |
| 76. | Cooper | 815 | BWR | NPPD | 86.95 |
| 77. | Catawba-1 | 1251.6 | PWR | Duke | 86.90 |
| 78. | Beaver Valley-1 | 963 | PWR | Vistra | 86.75 |
| 79. | Hope Creek | 1237 | BWR | PSEG | 86.64 |
| 80. | St. Lucie-1 | 1062 | PWR | NextEra | 86.25 |
| 81. | Browns Ferry-3 | 1254.7 | BWR | TVA | 86.14 |
| 82. | Robinson-2 | 821.54 | PWR | Duke | 85.96 |
| 83. | Millstone-2 | 877.2 | PWR | Dominion | 85.61 |
| 84. | Millstone-3 | 1247 | PWR | Dominion | 83.69 |
| 85. | River Bend | 967 | BWR | Entergy | 83.41 |
| 86. | St. Lucie-2 | 1074 | PWR | NextEra | 82.39 |
| 87. | Fermi-2 | 1150 | BWR | DTE | 80.38 |
| 88. | Prairie Island-2 | 557 | PWR | Xcel | 80.00 |
| 89. | Grand Gulf | 1485 | BWR | Entergy | 79.69 |
| 90. | Sequoyah-2 | 1177.46 | PWR | TVA | 78.77 |
| 91. | Prairie Island-1 | 557 | PWR | Xcel | 75.08 |
| 92. | Waterford-3 | 1102 | PWR | Entergy | 71.56 |
Note: Capacity factors have been rounded. There are no ties, four sets of rounded near-ties notwithstanding—e.g., Oconee-3 and Harris had capacity factors of 92.3936 and 92.3852, respectively.
*This is the design electrical rating (DER) in megawatts-electric, effective as of December 31, 2024. If a reactor’s rating has changed during the three-year period, the capacity factor is calculated with appropriate weighting.
The United States now has 94 reactors in commercial operation, but this survey includes data only from the 92 reactors that were operating for the full three years in the timeframe 2022–2024. Vogtle-3 and -4 will appear in this survey in 2027 and 2028, respectively, after each reactor has been through three full calendar years of operation.
This year, every reactor in the survey has a capacity factor over 70, which has happened in only one previous three-year period (2014–2016). Stable as capacity factors are now, this level of performance was unthinkable just three decades ago. Consider this: for 1992–1994, just two units had three-year capacity factors above 90 percent, and 78 reactors had capacity factors above 70 percent. By 2001–2003, 47 of 104 reactors had capacity factors of 90 percent or greater, and all but two were above 70 percent. This year, we’re reporting 54 of 92 reactors above 90, and all 92 reactors above 70 percent.
Nationwide stats
The median of 90.96 for fleetwide 2022–2024 capacity factors is just below 91 percent for the second year in a row; the median in 2019–2021 was 91.24. That incremental decrease is echoed in other data points, including both the top and bottom quartiles of the 2022–2024 data set (Fig. 2). The average capacity factor for all 92 reactors is 90.36. In comparison, the average for 2019–2021 was 90.87; it was 90.31 in 2016–2018 and 89.52 in 2013–2015.
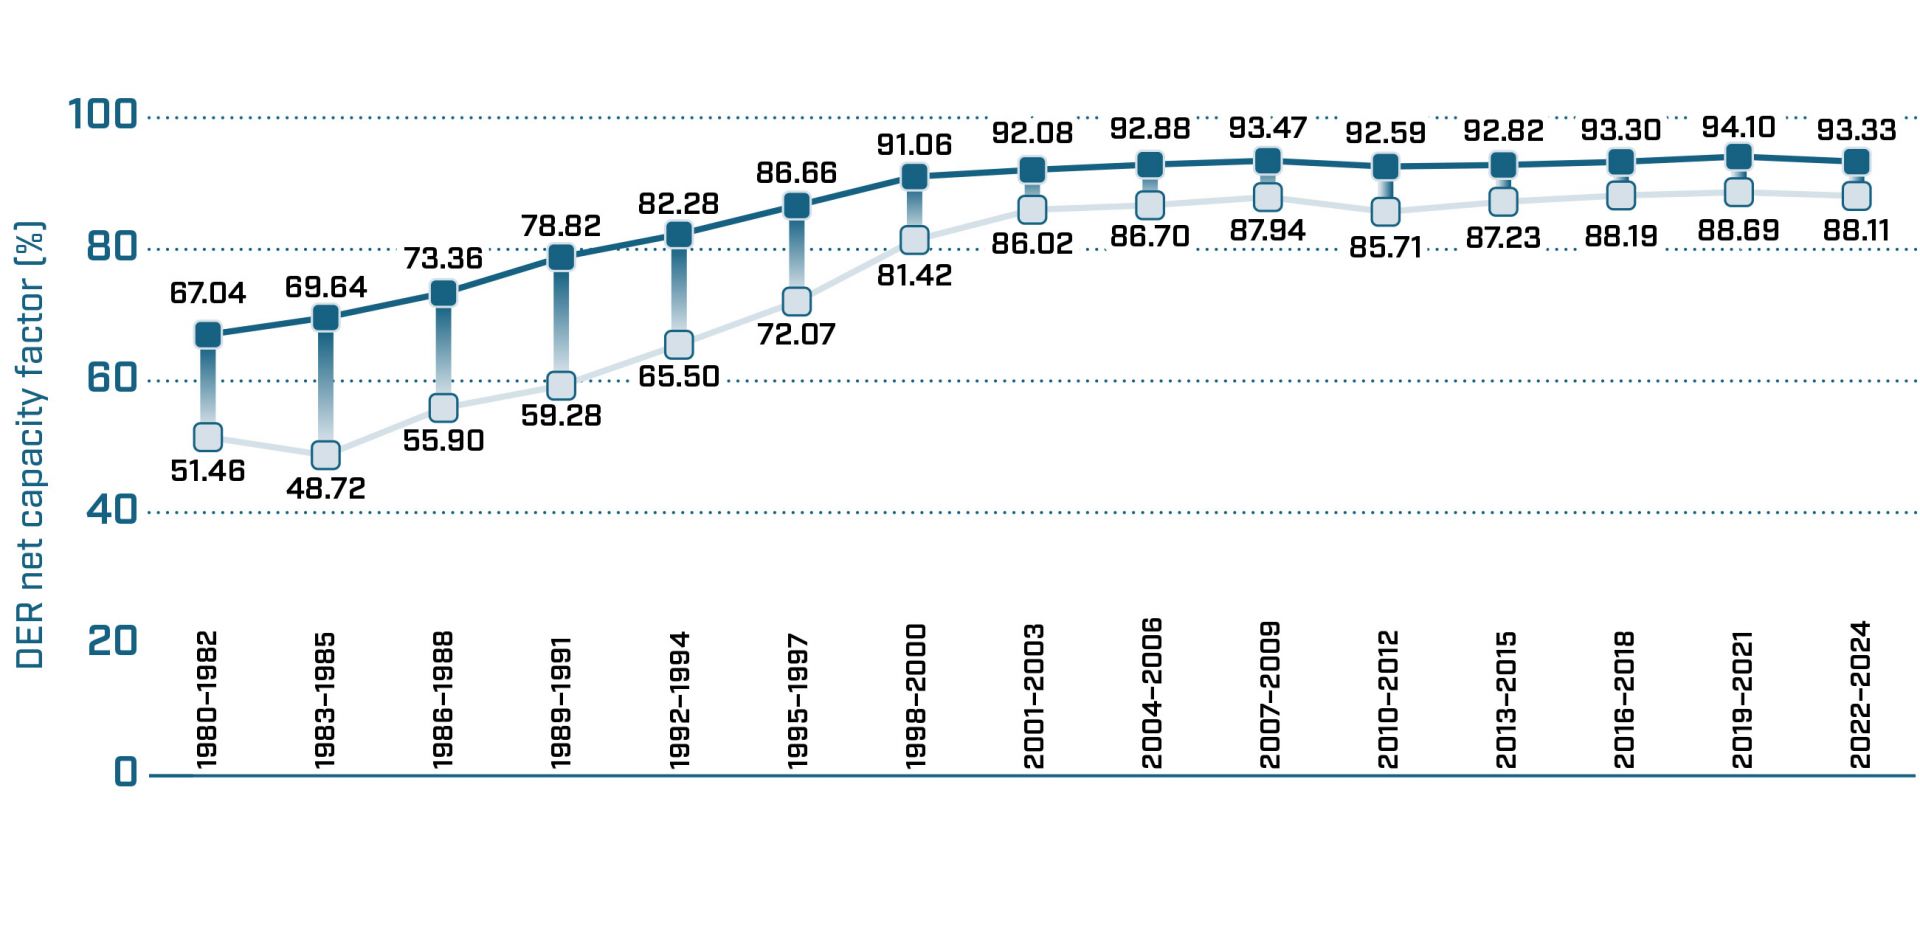
Fig. 2. All reactors, top and bottom quartiles.
Each reactor’s 2022–2024 capacity factor is compared against its own 2019–2021 performance in Table 2. A majority—52—posted a capacity factor below their 2019–2021 factors.
Table 2. Capacity factor change, 2019–2021 to 2022–2024
| Rank | Reactor | % Change |
|---|---|---|
| 1. | Callaway | 22.45 |
| 2. | Diablo Canyon-2 | 18.14 |
| 3. | Salem-1 | 10.06 |
| 4. | ANO-2 | 9.83 |
| 5. | St. Lucie-1 | 5.58 |
| 6. | Hatch-2 | 5.25 |
| 7. | Columbia | 4.70 |
| 8. | Grand Gulf | 4.64 |
| 9. | LaSalle-2 | 4.61 |
| 10. | Watts Bar-2 | 4.29 |
| 11. | Browns Ferry-2 | 4.07 |
| 12. | Turkey Point-4 | 4.07 |
| 13. | Dresden-2 | 3.90 |
| 14. | Brunswick-2 | 3.81 |
| 15. | Turkey Point-3 | 3.32 |
| 16. | Watts Bar-1 | 3.21 |
| 17. | Ginna | 2.97 |
| 18. | Palo Verde-3 | 2.50 |
| 19. | Clinton | 2.32 |
| 20. | Summer | 2.17 |
| 21. | Quad Cities-1 | 2.08 |
| 22. | Oconee-2 | 1.96 |
| 23. | Brunswick-1 | 1.92 |
| 24. | Limerick-2 | 1.77 |
| 25. | Peach Bottom-3 | 1.72 |
| 26. | Comanche Peak-2 | 1.67 |
| 27. | Monticello | 1.62 |
| 28. | Susquehanna-2 | 1.41 |
| 29. | Nine Mile Point-1 | 1.23 |
| 30. | Palo Verde-1 | 1.02 |
| 31. | Cook-2 | 0.93 |
| Rank | Reactor | % Change |
|---|---|---|
| 32. | North Anna-1 | 0.80 |
| 33. | Cook-1 | 0.80 |
| 34. | Harris | 0.75 |
| 35. | Sequoyah-1 | 0.71 |
| 36. | Wolf Creek | 0.57 |
| 37. | Point Beach-2 | 0.49 |
| 38. | Point Beach-1 | 0.42 |
| 39. | Farley-2 | 0.27 |
| 40. | Calvert Cliffs-2 | 0.23 |
| 41. | Salem-2 | 0.00 |
| 42. | Vogtle-2 | -0.35 |
| 43. | Braidwood-2 | -0.45 |
| 44. | Byron-1 | -0.58 |
| 45. | Beaver Valley-2 | -0.64 |
| 46. | Braidwood-1 | -0.65 |
| 47. | Oconee-1 | -0.79 |
| 48. | McGuire-1 | -0.81 |
| 49. | Hope Creek | -0.92 |
| 50. | Byron-2 | -1.19 |
| 51. | Palo Verde-2 | -1.39 |
| 52. | McGuire-2 | -1.41 |
| 53. | Vogtle-1 | -1.47 |
| 54. | Comanche Peak-1 | -1.47 |
| 55. | Hatch-1 | -1.48 |
| 56. | Seabrook | -1.51 |
| 57. | Surry-2 | -1.59 |
| 58. | Catawba-2 | -1.61 |
| 59. | Peach Bottom-2 | -2.10 |
| 60. | Perry | -2.18 |
| 61. | Dresden-3 | -2.20 |
| 62. | North Anna-2 | -2.51 |
| Rank | Reactor | % Change |
|---|---|---|
| 63. | Robinson-2 | -2.58 |
| 64. | FitzPatrick | -2.72 |
| 65. | Surry-1 | -2.80 |
| 66. | Diablo Canyon-1 | -2.81 |
| 67. | South Texas-1 | -2.81 |
| 68. | LaSalle-1 | -2.89 |
| 69. | Calvert Cliffs-1 | -3.02 |
| 70. | River Bend | -3.19 |
| 71. | Limerick-1 | -3.21 |
| 72. | Beaver Valley-1 | -3.34 |
| 73. | Susquehanna-1 | -3.46 |
| 74. | Fermi-2 | -3.48 |
| 75. | Nine Mile Point-2 | -3.56 |
| 76. | South Texas-2 | -3.58 |
| 77. | Oconee-3 | -3.60 |
| 78. | Davis-Besse | -4.23 |
| 79. | ANO-1 | -4.34 |
| 80. | Catawba-1 | -4.35 |
| 81. | Farley-1 | -4.94 |
| 82. | Millstone-2 | -5.00 |
| 83. | St. Lucie-2 | -5.58 |
| 84. | Millstone-3 | -5.65 |
| 85. | Quad Cities-2 | -6.28 |
| 86. | Cooper | -6.44 |
| 87. | Sequoyah-2 | -11.37 |
| 88. | Prairie Island-2 | -11.56 |
| 89. | Browns Ferry-1 | -12.18 |
| 90. | Waterford-3 | -13.94 |
| 91. | Browns Ferry-3 | -15.28 |
| 92. | Prairie Island-1 | -19.69 |
Note: These numbers have been rounded. There are no ties, four sets of rounded near-ties notwithstanding—e.g., Browns Ferry-2 had a capacity factor increase of 4.0728, while Turkey Point-4 had a capacity factor increase of 4.0659. Salem-2 had a decrease of -0.0024, rounded here to 0.00.
The nation’s 31 boiling water reactors had a median capacity factor of 91.19, while the 61 pressurized water reactors came in at 90.73. Average capacity factors for BWRs and PWRs have a similar spread: the average for BWRs in this survey is 90.82, while the average for PWRs is 90.13. The 2022–2024 capacity factor for every BWR and PWR listed in Table 1 is graphed by DER capacity and reactor age in Fig. 3.
The combined capacity factors of the nation’s 35 multiunit plants—those with two, three, or four co-located reactors—had a median of 90.72 for 2022–2024 (see Table 3), while the average was 90.81. The 17 single-unit plants posted a median factor of 90.27 and an average of 87.96.
U.S. power reactors average about 43 years of operation (without Vogtle-3 and -4, the average would be 44). The 10 oldest reactors have an average factor of 93.15, and the top 20 have an average factor of 91.67. A select group of 20 are the subjects of subsequent license renewal applications that either have been approved or are under review at this writing. Those 20 SLR applicants have a sterling average capacity factor of 92.59—evidence of excellence over the long term.
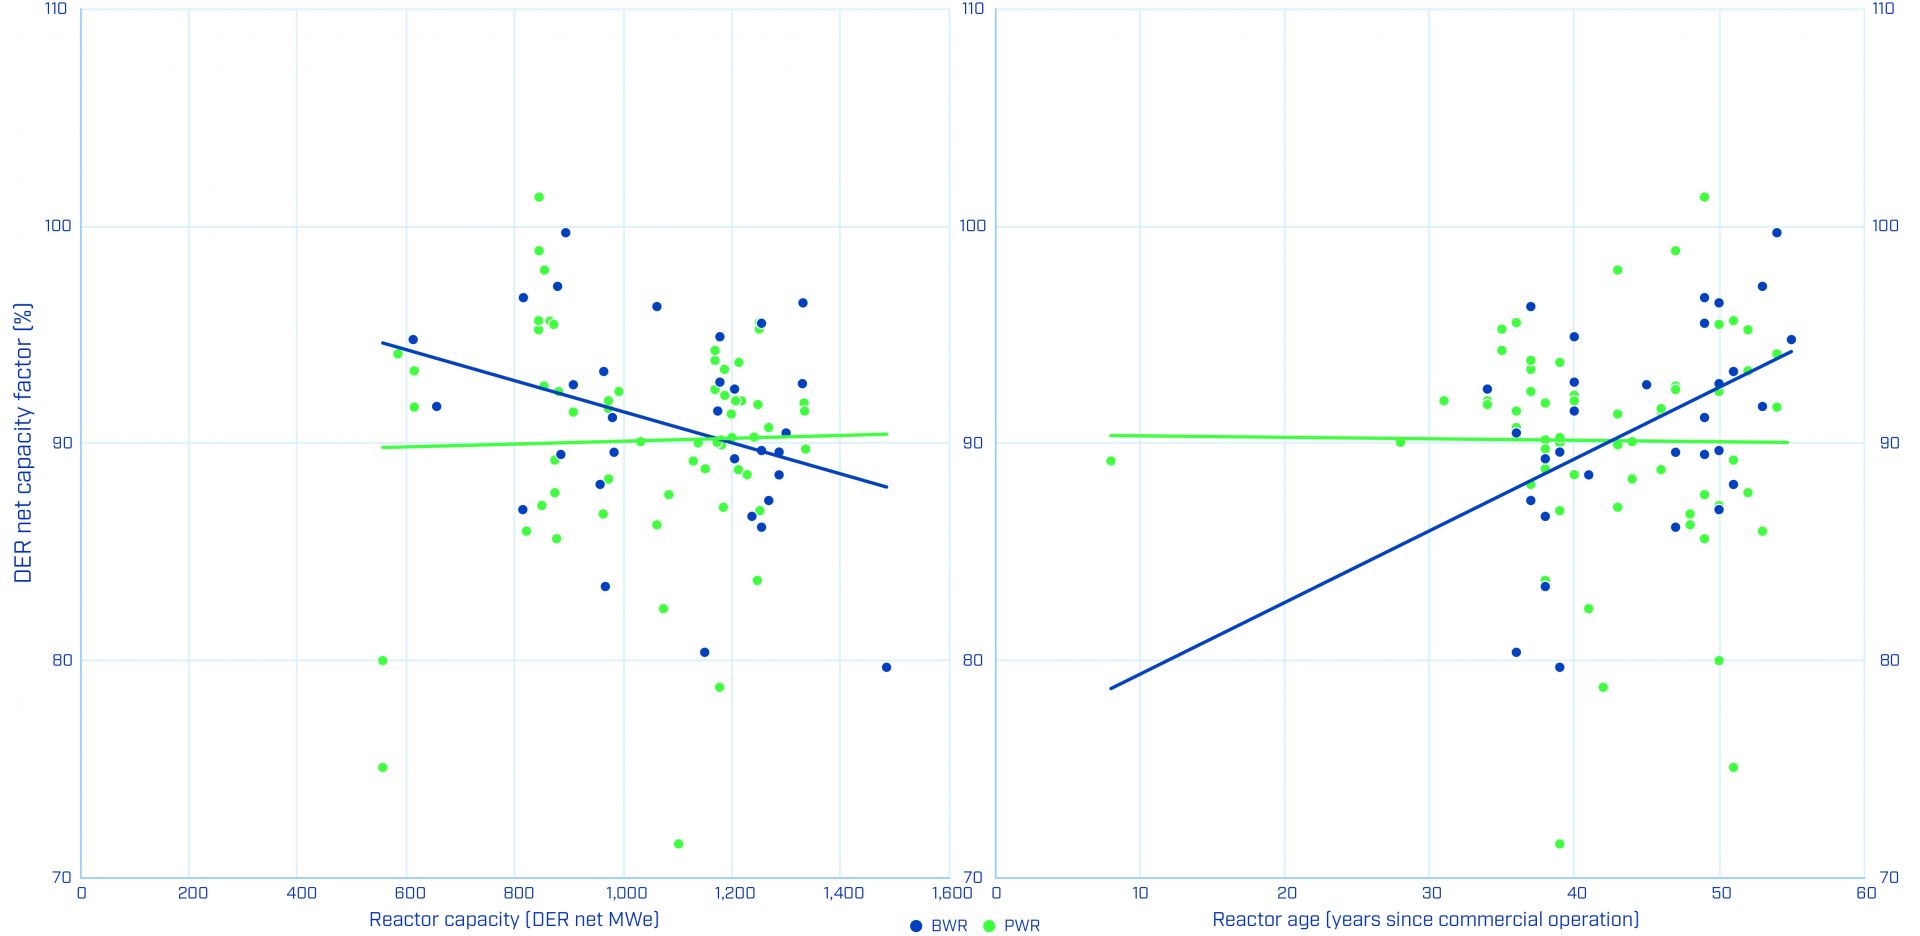
Fig. 3. Capacity factors of BWRs and PWRs, by reactor capacity and age. The capacity factor of every reactor included in Table 1 is plotted twice in this figure, against both DER net capacity (left) and years of reactor operation as of the end of 2024 (right), with linear trend lines.
Room for improvement
Last year, this feature predicted that Ameren’s Callaway, a 1,228-net MWe PWR, might move near the top of Table 2, and that it does, taking the top spot with the most improved capacity factor, up by 22.45 percentage points. In 2019–2021, with a capacity factor of 66.11, the reactor came in dead last in both Table 1 and Table 2. Callaway turned around its performance after it was forced off line for several months after multiple unplanned scrams in 2020. Callaway’s most recent three-year factor of 88.56 pulls it out of last place—and out of the bottom quartile.
Entergy’s Waterford-3 had a series of challenges in 2024—and a little bad luck—and now replaces Callaway at the bottom of Table 1. The unit was shut down for a refueling outage in October 2023 that extended into February. Two forced outages followed in March, including one that began with a transformer fire that kept the reactor off line until mid-May, when it came back on line with only one main transformer in service. Bad luck then struck in June—eight lightning strikes in the area within a minute and a half were the probable direct cause of a voltage transient on the power supply to the core protection calculators. Altogether, Waterford lost 95 days of service in 2024 and is now limited to 94 percent reactor power with a temporary replacement transformer.
As for Table 2, Prairie Island-1 was the unit with the largest capacity factor decrease in this survey, falling 19.69 percentage points to a three-year capacity factor of 75.08. A forced outage in October 2023 kept the unit off line into January 2024, and a refueling outage that began in September 2024 didn’t end until mid-January 2025. Altogether, the unit logged a total of 127 days at zero power in 2024. Prairie Island-2 also had down time in 2024 when a scheduled refueling outage that began in early October 2023 was extended until early March 2024, contributing to a total of 74 days at zero power in 2024. These issues all contributed to two-unit Prairie Island’s position at the bottom of Table 3.
Table 3. DER net capacity factors of multireactor sites
| Rank | Site | Factor |
|---|---|---|
| 1. | Calvert Cliffs | 100.10 |
| 2. | Dresden | 98.48 |
| 3. | Turkey Point | 95.44 |
| 4. | South Texas | 95.41 |
| 5. | Farley | 95.32 |
| 6. | Peach Bottom | 94.61 |
| 7. | Oconee | 94.49 |
| 8. | Vogtle | 94.05 |
| 9. | LaSalle | 93.86 |
| 10. | Byron | 93.57 |
| 11. | FitzPatrick/NMP | 93.31 |
| 12. | Point Beach | 92.51 |
| 13. | Comanche Peak | 91.96 |
| 14. | McGuire | 91.78 |
| 15. | Hatch | 91.11 |
| 16. | Palo Verde | 91.03 |
| 17. | Limerick | 90.90 |
| 18. | Quad Cities | 90.72 |
| Rank | Site | Factor |
|---|---|---|
| 19. | Braidwood | 90.51 |
| 20. | Browns Ferry | 90.45 |
| 21. | Brunswick | 90.39 |
| 22. | North Anna | 89.98 |
| 23. | Watts Bar | 89.63 |
| 24. | Hope Creek/Salem | 89.63 |
| 25. | Diablo Canyon | 89.42 |
| 26. | Susquehanna | 89.08 |
| 27. | ANO | 88.75 |
| 28. | Catawba | 88.48 |
| 29. | Surry | 88.48 |
| 30. | Cook | 88.25 |
| 31. | Beaver Valley | 87.43 |
| 32. | Millstone | 84.48 |
| 33. | St. Lucie | 84.31 |
| 34. | Sequoyah | 82.92 |
| 35. | Prairie Island | 77.54 |
Note: Hope Creek and Salem are treated as a single site because they are adjacent and have the same owner; the two-unit Salem had a 2022–2024 factor of 91.20. FitzPatrick, which is adjacent to Nine Mile Point, was purchased by Constellation in March 2017, and the two plants are now treated as a single site; the two-unit Nine Mile Point had a 2022–2024 factor of 91.86.
Issues at the Tennessee Valley Authority’s Browns Ferry-2 and both of its Watts Bar units meant the three reactors spent time during 2024 in the Nuclear Regulatory Commission’s “regulatory response” category of reactor oversight.
TVA’s Sequoyah-1 and -2 were not under increased oversight, but their capacity factors contributed to TVA’s relatively lower combined capacity factor in 2022–2024. Sequoyah-1 suffered successive generator breaker trips in late summer 2024, while Sequoyah-2’s unplanned shutdown in July 2024 evolved into an extensive main generator refurbishment. At this writing in early April, the reactor was not yet back on line.
Fleet performance
Many of today’s plants are first-of-a-kind or one-of-a-kind, built to an owner’s wishes rather than to a standard design. To capture nth-of-a-kind cost savings, the Department of Energy’s Pathways to Commercial Liftoff: Advanced Nuclear report lays out the case for first building a consortium of committed buyers and then building a fleet of identical reactors.
Today, a fleet approach to nuclear power means a focus on operations—pooling resources and management best practices across a company’s reactor assets. Does being part of a fleet improve capacity factors? The data are mixed.
The median of the combined factors of the nine utilities with two or more plant sites for 2022–2024 is 89.66, and the average factor is 88.81; both figures are lower than the entire fleet median and average (see Table 4 and Fig. 4). The same figures were 91.79 and 90.82 for 2019–2021.
Table 4. DER net capacity factors of owners of more than one site
| Rank | Owner/Operator | Factor | % Change |
|---|---|---|---|
| 1. | Constellation | 93.85 | -0.47 |
| 2. | Southern | 93.52 | -0.45 |
| 3. | Duke | 91.08 | -0.71 |
| 4. | NextEra | 90.37 | 0.77 |
| 5. | Vistra | 89.66 | -1.18 |
| 6. | Dominion | 88.16 | -2.18 |
| 7. | TVA | 88.12 | -3.68 |
| 8. | Xcel | 82.79 | -9.23 |
| 9. | Entergy | 81.73 | -0.97 |
Note: This table lists the 2022–2024 combined capacity factor of all reactors in an owner's fleet, and the combined capacity factor change relative to 2019–2021.
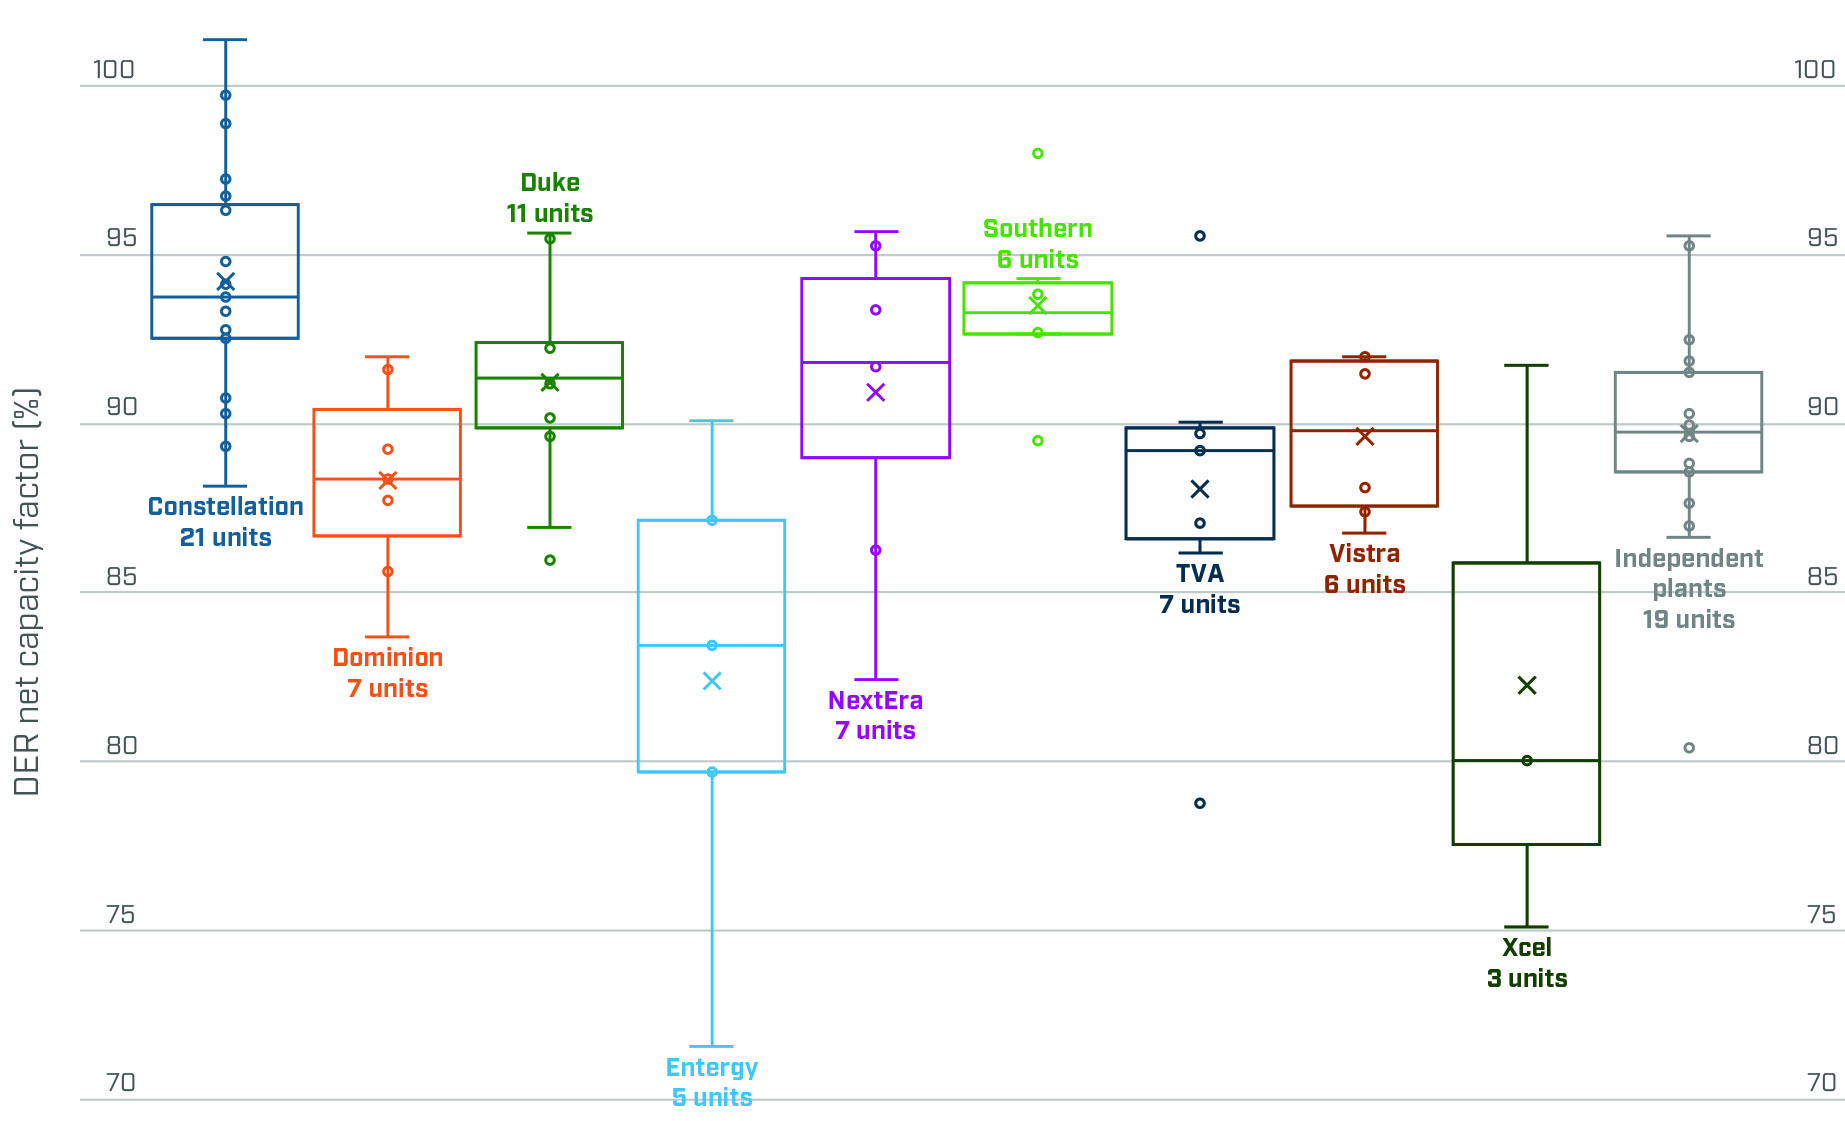
Fig. 4. Capacity factors by utility. These plots draw on the 2022–2024 capacity factor of every reactor included in Table 1, grouped by utility; the number of units owned and operated by each utility is indicated. (To aid in interpretation of the data, the 19 reactors at a plant owned by an entity that does not hold other nuclear power plants are grouped and plotted here as “Independent plants.”) While the median, mean, quartiles, and outliers of each utility are shown, the usefulness of plots for utilities with smaller data sets is limited.
Looking closer at the nine utilities’ combined capacity factors, all but one (NextEra) decreased across successive three-year periods. While most of those decreases were small, TVA and Xcel saw their combined capacity factors drop by 3.68 and 9.23, respectively, pulled down by performance at TVA’s Sequoyah and Xcel’s Prairie Island.
In 2022–2024, the 19 reactors at 11 sites that weren’t part of a multiplant utility improved (as a group) on their performance in 2019–2021, with a median factor of 89.74 and an average factor of 89.69. In 2019–2021, the same group had 21 reactors (including Comanche Peak-1 and -2) with a median factor of 89.70 and an average factor of 88.10.
Bigger is better?
Constellation has the largest fleet today—21 reactors—and posted the highest total three-year capacity factor out of the nine nuclear fleet operators in the U.S. for the fifth year running. But that wasn’t always the case.
Decades ago, electricity market deregulation spurred some companies to shed their nuclear power plants, and others to buy. Entergy’s acquisition of the Pilgrim plant from Boston Edison in 1999 was the first in a series of acquisitions, as multiregional nuclear operating utilities bought up reactors that typically were the only nuclear asset in a local utility’s portfolio.
Before the turn of the century, Constellation’s current operating fleet of 21 reactors was owned by no fewer than seven different companies (see Fig. 5). A merger in 2000 combined ComEd’s five Illinois plants (Braidwood, Byron, Dresden, LaSalle, and Quad Cities)—relative underperformers at the time—with PECO’s two (Limerick and Peach Bottom) in Pennsylvania to form Exelon (now Constellation). The company grew slowly until it had 23 reactors in operation (after buying FitzPatrick from Entergy in 2017 and before shutting down Oyster Creek in 2018). Constellation could become a fleet of 22 again if and when Three Mile Island-1 makes its comeback, renamed for the late Exelon CEO Christopher Crane, who led key elements of the company’s success after joining in 1998.
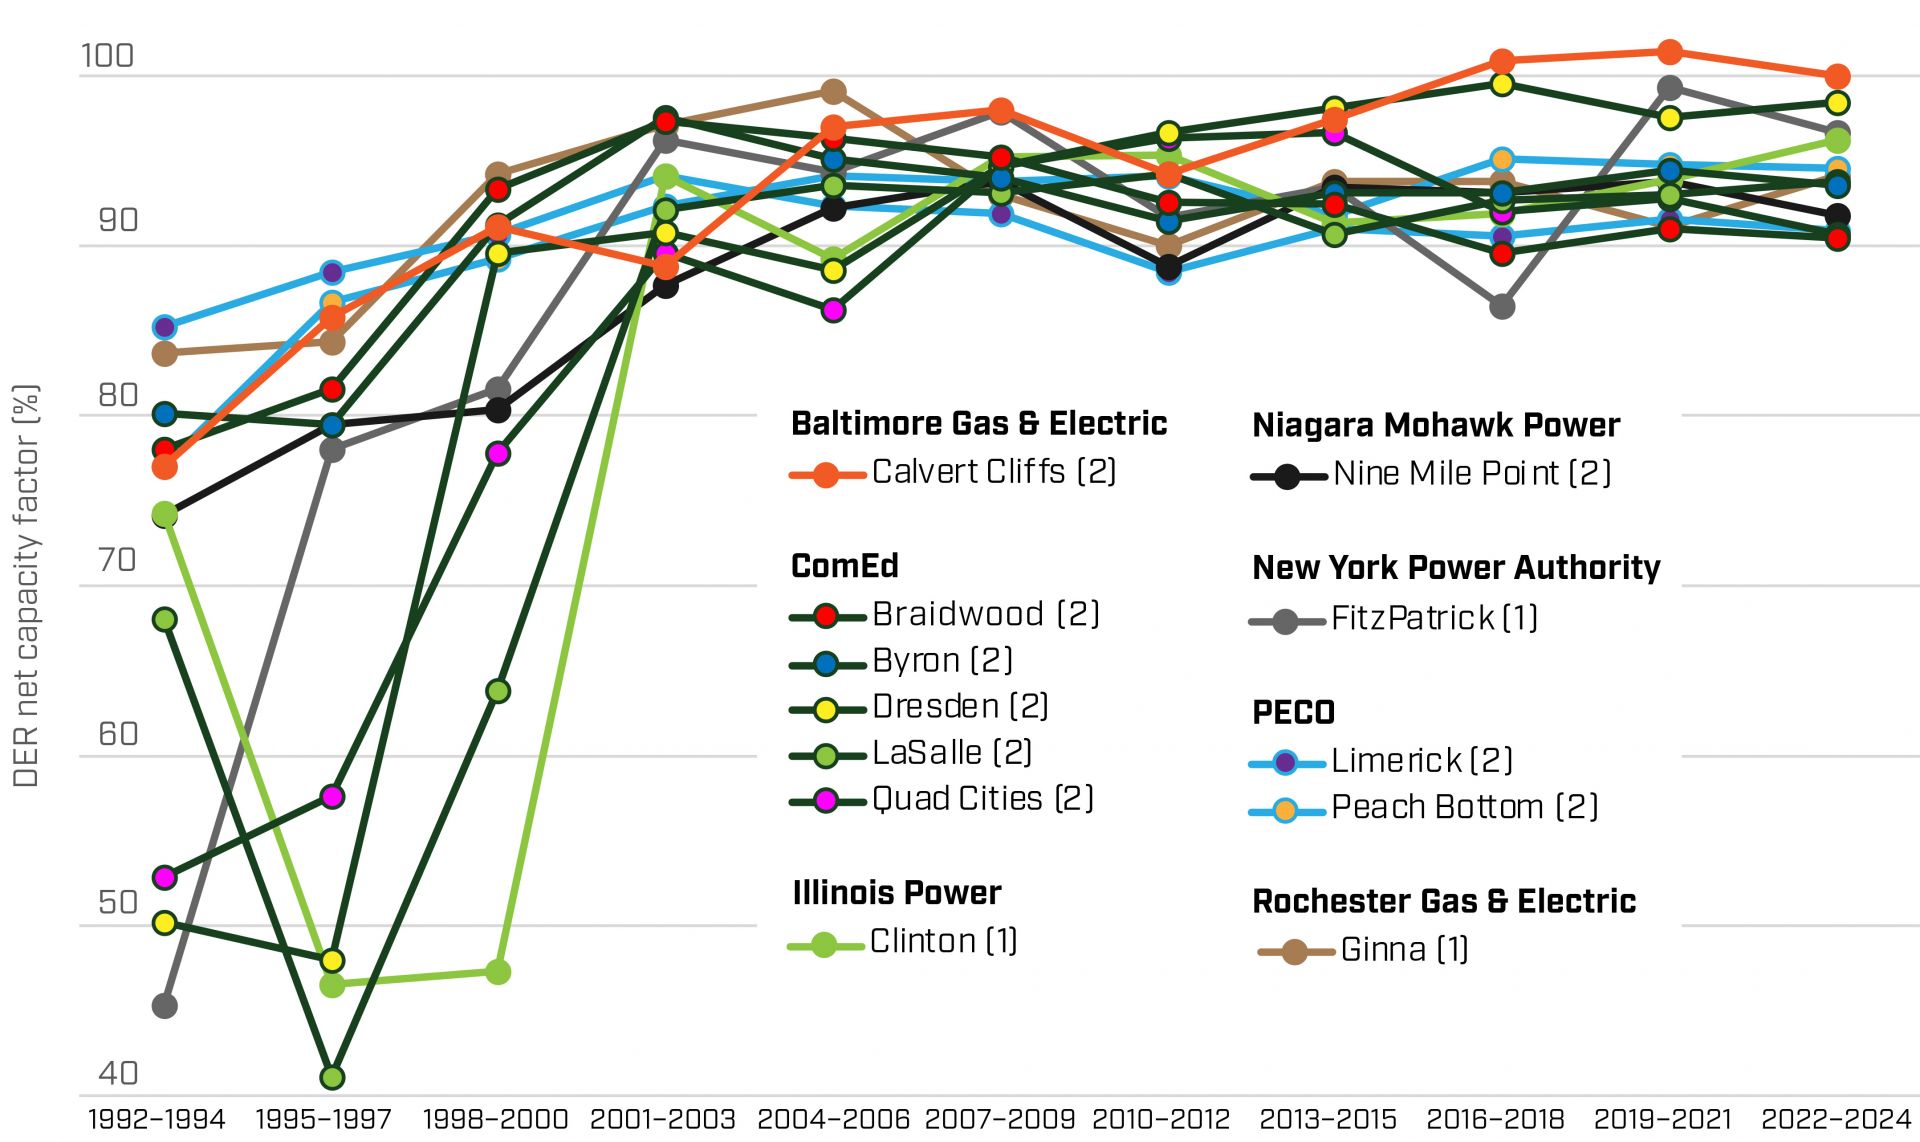
Fig. 5. Capacity factors of plants in the Constellation nuclear fleet. Successive three-year capacity factors since 1992–1994 of every nuclear plant site in Constellation’s current operating fleet is plotted here. The capacity factor for each two-unit plant site (see legend) is the combined capacity factor of both units. At the beginning of the period graphed here, the plants were owned by seven different companies, as indicated in the legend and with different line colors for each former owner.
The dramatic improvement of the reactors included in Fig. 5 was not unique to Constellation, but part of an industry-wide improvement spurred by market factors, technology and management advances, and sharing of best practices. But the company’s success with other companies’ discards suggests that nuclear is a long-term asset to buy and hold, and that fleet management can be effective.
Power in demand
The nuclear community’s long-term push for recognition of nuclear power’s clean energy attributes now has a powerful ally: big tech. Microsoft announced its TMI-1 power purchase agreement with Constellation in September 2024 as “a significant supply of net-new, reliable, carbon-free electricity.” Amazon said in October 2024 that it was backing nuclear for its “decades-long record of providing a reliable source of safe carbon-free energy.” Google expects its investment in Kairos Power to “help more communities benefit from clean and affordable nuclear power,” while Meta put out a request for proposals in December to get some of its own “clean, firm, and abundant energy.”
Tech companies and data center developers want more clean power than they can get at the moment. Lawrence Berkeley National Laboratory issued a report in December estimating that data center electricity consumption could double or even triple by 2028, to as much as 12 percent of U.S. electricity consumption. If recession fears materialize and make demand expectations look more like a bubble than a boom, generative AI/machine learning is still likely to grow, and with it, data center demand.
Reactors want long runs at full power. That’s good for the grid, but it also means they have something in common with data centers. Data center operators and cryptocurrency mining operations want steady grid power and are programmed to leave the grid and switch to backup power in the case of a minor grid fault to protect data center equipment from damage from a temporary voltage drop. That’s a problem, because the sudden loss of load can then cascade through the grid, risking blackouts.
In its 2024 Long-Term Reliability Assessment, released in December, the North American Electric Reliability Corporation (NERC) called the behavior of large data centers during “normal grid faults” an “emerging concern.” In grids already destabilized by invertor-based wind and solar resources, stability—in the form of nuclear energy’s baseload inertia—is in demand.
Dominance through stability
Since the turn of the century, total nuclear capacity increased—through uprates—even as reactors shut down. There is demand for more uprates, especially if backed by investment tax credits. But once uprates are maxed out, new nuclear capacity requires new builds backed by domestic construction and fuel supply chains. Build it, and you get a baseload generating asset that is likely to operate steadily for decades, and through multiple gas price fluctuations.
There are reactor designs suited to every end user. Some have access to substantial financial backing. But all are facing uncertainty about international supply chains and the future of investment and production tax credits like those already appropriated by Congress.
For now, nuclear power has bipartisan support. If that support is translated into policy choices that increase stability and reduce financial risk, investors, vendors, utilities, and suppliers can push through their investment inertia to build nuclear plants and their supply chains, bringing more nuclear stability to the grid.
Susan Gallier is a Nuclear News staff writer focusing on research and applications of nuclear science and technology.