
-3 2x1.jpg)
West Valley’s MPPB: 3D model proves instrumental for disposition
October 8, 2025, 3:22PMRadwaste Solutions
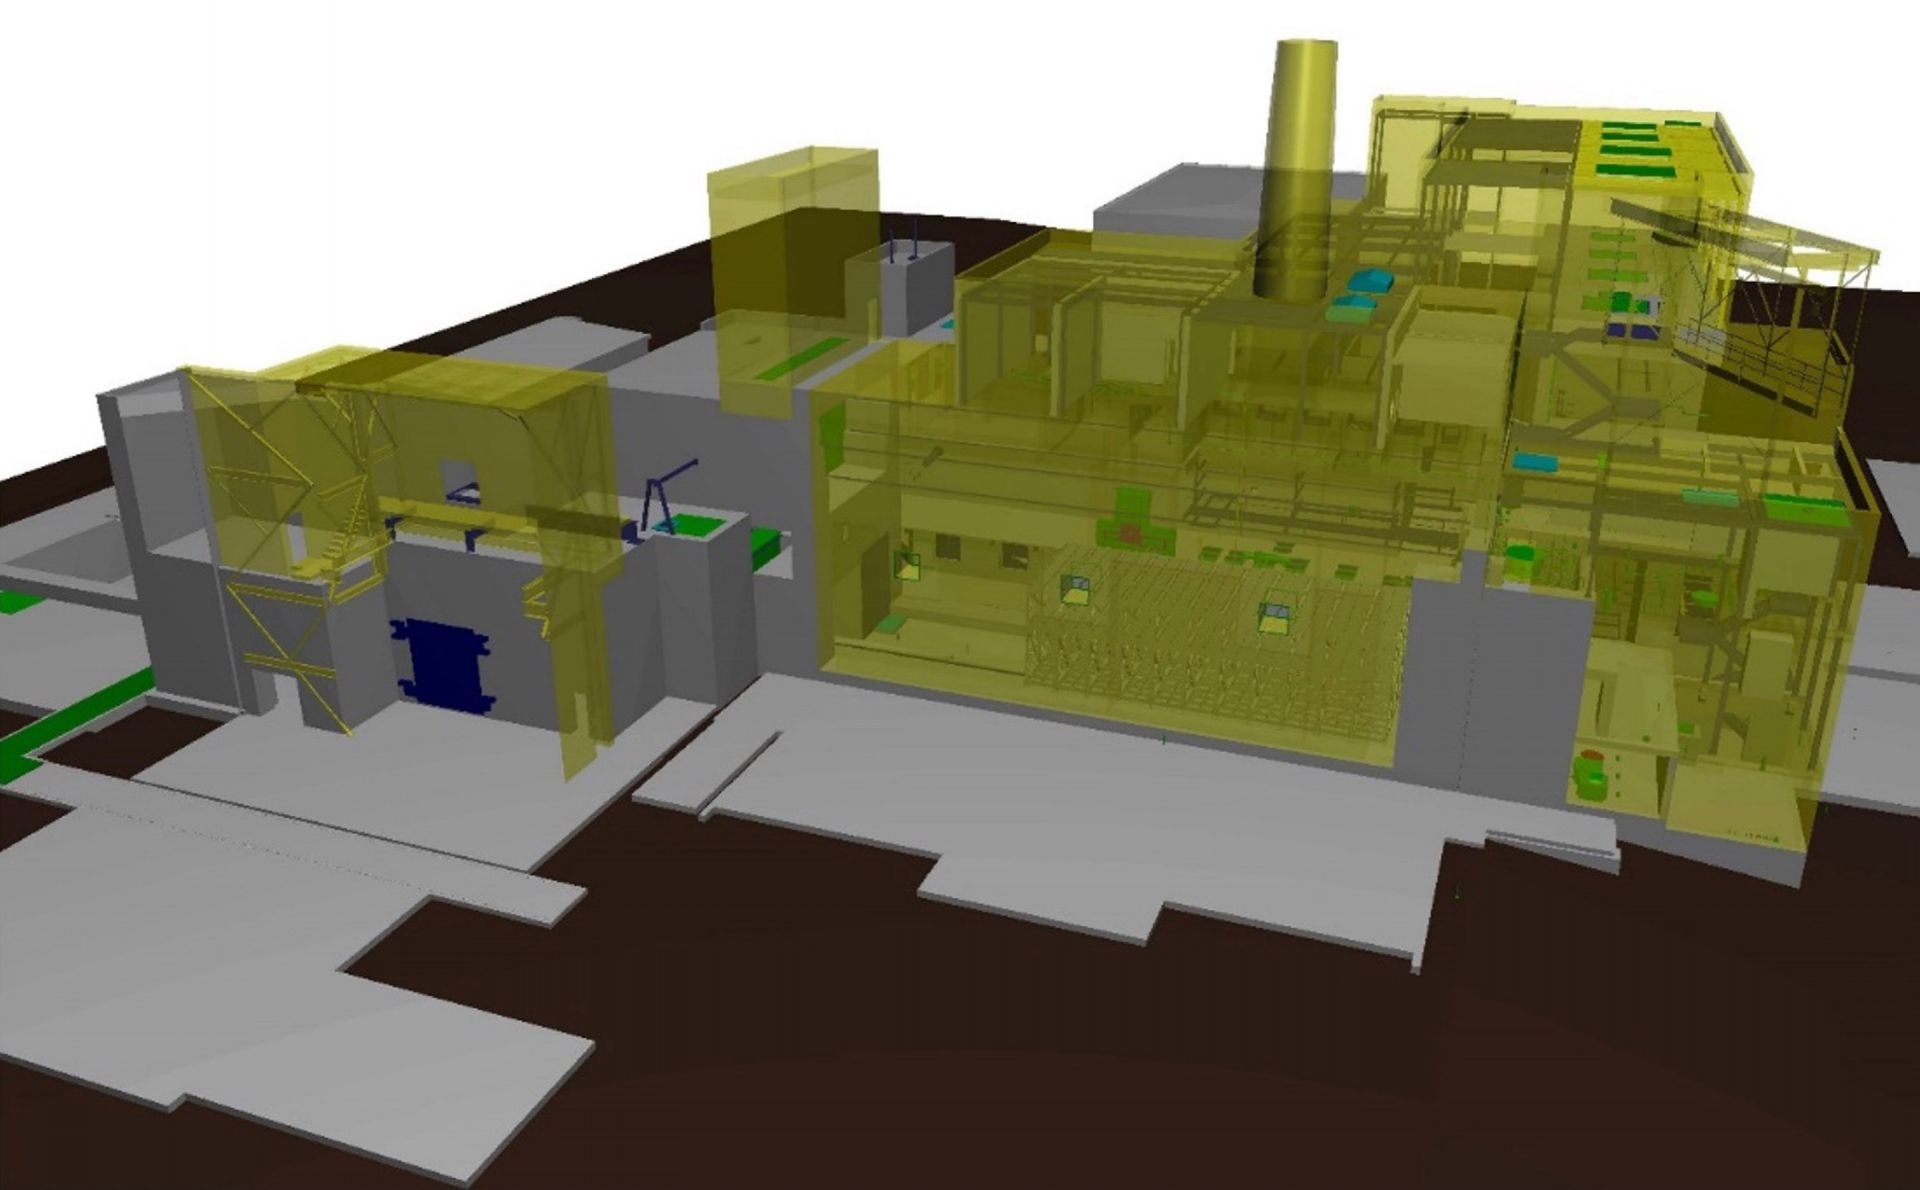
A 3D rendering of the MPPB.
Areas of the building where demolition has been completed are rendered
in transparent yellow.
Starting in 1966, the Western New York Nuclear Service Center (WNYNSC)—comprising 3,300 acres of land in the town of Ashford, N.Y.—was used for the commercial reprocessing of spent nuclear fuel. Reprocessing was conducted in the Main Plant Process Building (MPPB) until 1972 when commercial operations ceased and were never resumed. Now, 50 years later, modern 3D modeling technology is ensuring that the MPPB can be demolished in a safe and effective manner, minimizing risk to the environment and the workers.
To continue reading, log in or create a free account!