-3 2x1.jpg)
Powering the future: How the DOE is fueling nuclear fuel cycle research and development
As global interest in nuclear energy surges, the United States must remain at the forefront of research and development to ensure national energy security, advance nuclear technologies, and promote international cooperation on safety and nonproliferation. A crucial step in achieving this is analyzing how funding and resources are allocated to better understand how to direct future research and development. The Department of Energy has spearheaded this effort by funding hundreds of research projects across the country through the Nuclear Energy University Program (NEUP). This initiative has empowered dozens of universities to collaborate toward a nuclear-friendly future.
But as the DOE continues to invest in these projects, it’s essential to understand who is driving this research, what they aim to achieve, and how they are funded. By examining these factors, we can identify trends, opportunities, and areas for optimization to advance nuclear energy research. Fortunately, NEUP provides transparency through its website, detailing individual proposals, lead organizations, collaborators, and funding amounts. Projects are categorized and subcategorized for clarity, such as Research and Development focused on Reactor Development and Plant Optimization. As the DOE and NEUP continue their work, it’s crucial to track their progress, understand the impact of these projects, and identify opportunities for further collaboration and growth. By further embracing analysis of funding allocations and assessing the effectiveness of current initiatives in the nuclear fuel cycle (NFC) framework, we can inform strategies to maximize the impact of future investments. This will be vital in ensuring the United States remains a leader in nuclear energy and advances a sustainable, secure energy future.
Process
NEUP has invested hundreds of millions of dollars in initiatives across the NFC. To understand the impact of this funding, it’s essential to break down these initiatives by their specific location within the cycle.
Step 1: Categorization. The NFC process involves three main stages: front end, midpoint, and back end. The front end encompasses mining, enrichment, and fuel fabrication for nuclear power plants. The midpoint addresses power generation, as well as structural materials, licensing, and research not classified as front end or back end. The back end focuses on fuel reprocessing and waste management, including dry casks, vitrification, and fission products.
Step 2: Data collection and reconfiguration. All available information on NEUP projects from its website is compiled and reconfigured to fit the front end, midpoint, and back end categories. In addition, these projects are labeled by their location in the NFC.
Step 3: Analysis and visualization. Organizational and funding data across categorized projects are precisely measured, allocated, and analyzed using spreadsheets. Tableau, a data visualization tool, is employed to highlight key nationwide data points, offering a transparent geographic breakdown of NEUP’s investments.
By following this process, we can gain a deeper understanding of how NEUP’s funding is allocated across the NFC and identify trends and areas of focus in the program’s investments.
Results
The distribution of total funding, average funding, funding by state, and funding by organization are shown in Figs. 1 through 4, respectively. These visualizations form a roadmap, illuminating where funding is flowing and why. These data sets were further examined on collaborations (Fig. 5), project types (Fig. 6), and top-performing universities (Figs. 7 and 8), revealing the strategies and partnerships driving progress in nuclear energy.
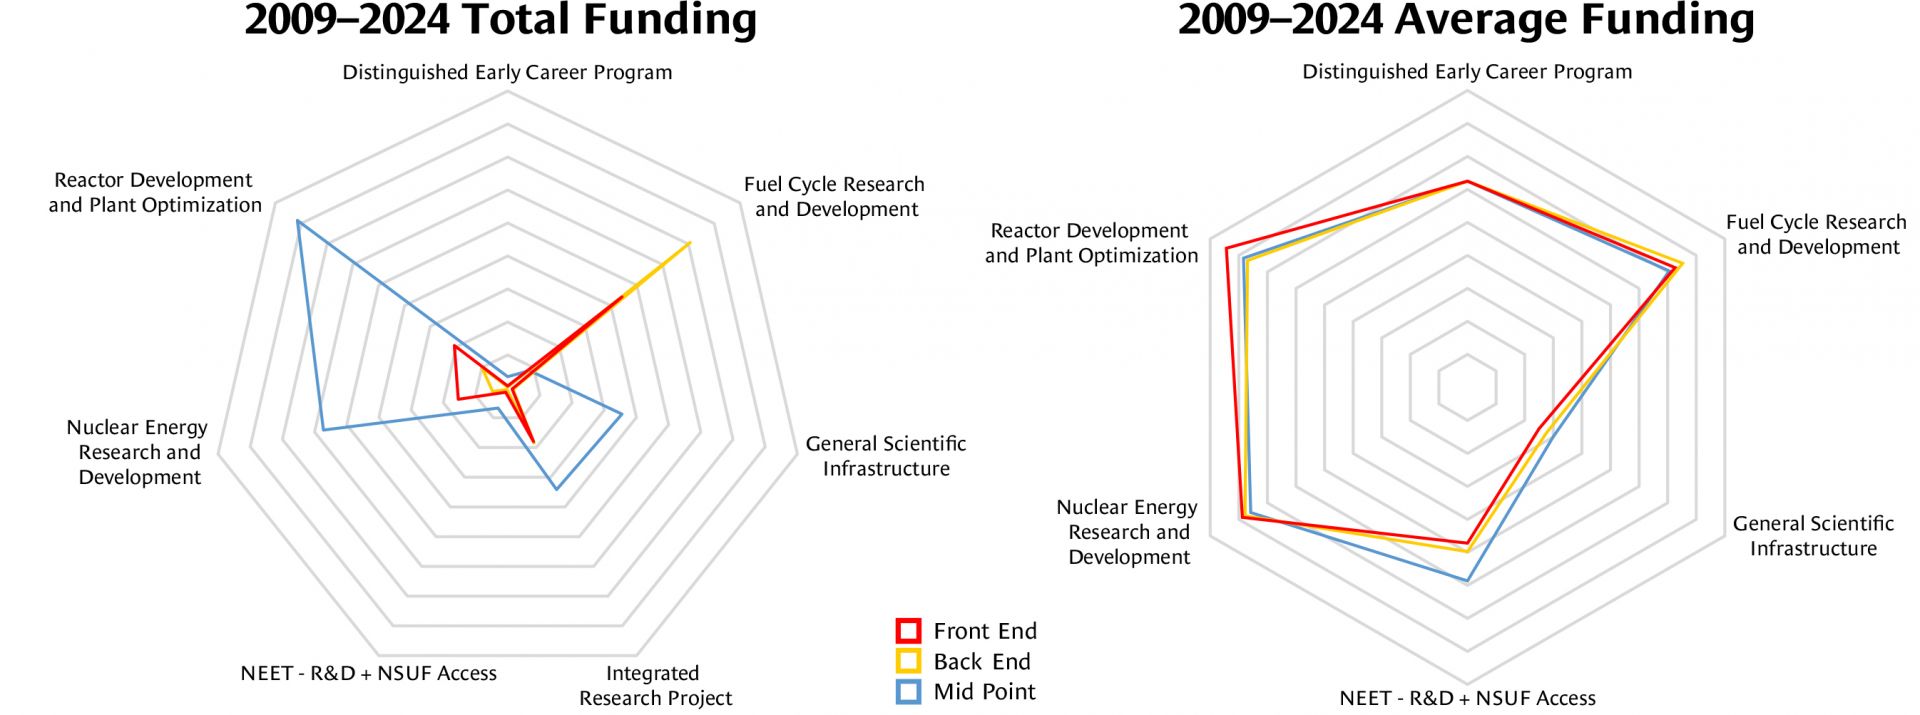
Fig. 1 (left): Funding across the nuclear fuel cycle. This radar chart illustrates the total funding distribution from 2009 to 2024 across various research programs in academic institutions. The chart compares funding at different locations of the NFC for key areas such as Reactor Development and Plant Optimization, Nuclear Energy Research and Development, and Fuel Cycle Research and Development. Each line of the septagon indicates a $20 million increment.
Fig. 2 (right): Average funding snapshot. This radar chart illustrates the total average distribution of funds from 2009 to 2024 across various research programs in academic institutions. The chart compares funding at different locations of the NFC for key areas such as Reactor Development and Plant Optimization, Nuclear Energy Research and Development, and Fuel Cycle Research and Development. Each line of the hexagon indicates a $500,000 increment. Note that IRPs, with their significantly larger funding amounts, are excluded to avoid skewing the picture.
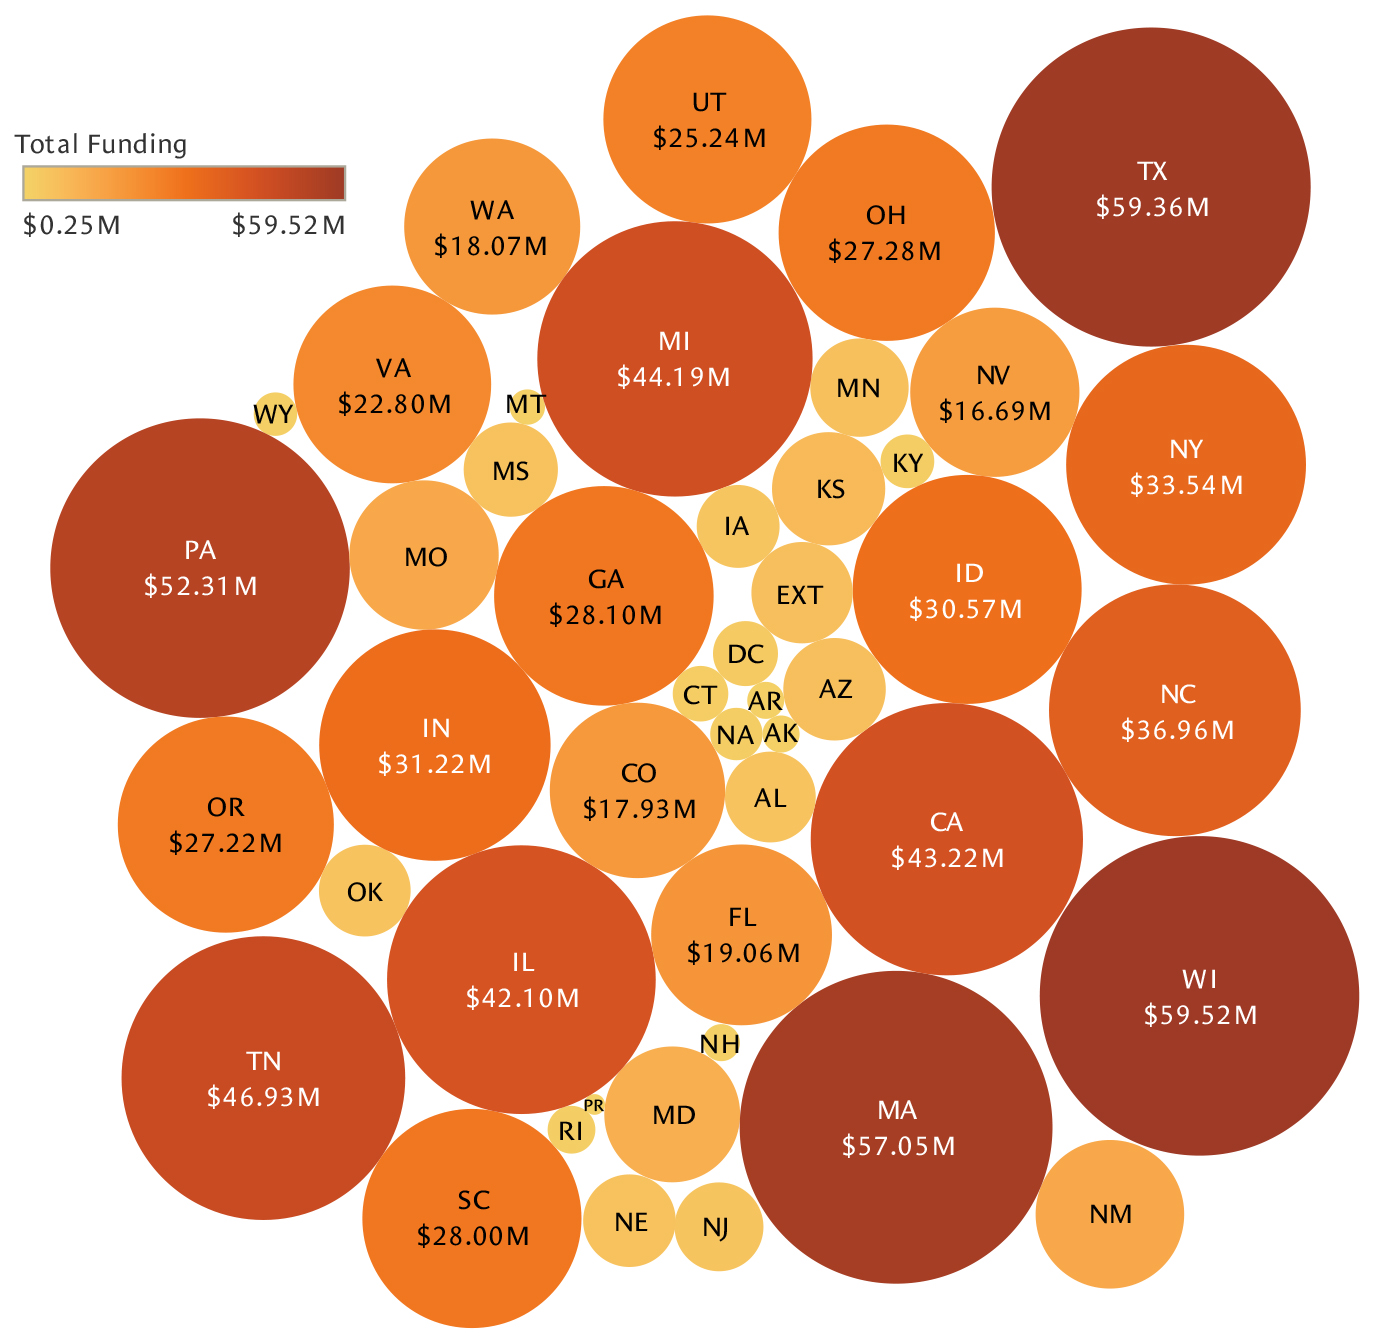
Fig. 3. Funding hotspots and coldspots. This bubble chart showcases the total funding each state has received from the DOE. Wisconsin, Texas, Massachusetts, and Pennsylvania have received the most funding, while Puerto Rico, New Hampshire, Arizona, and Arkansas have received the least.
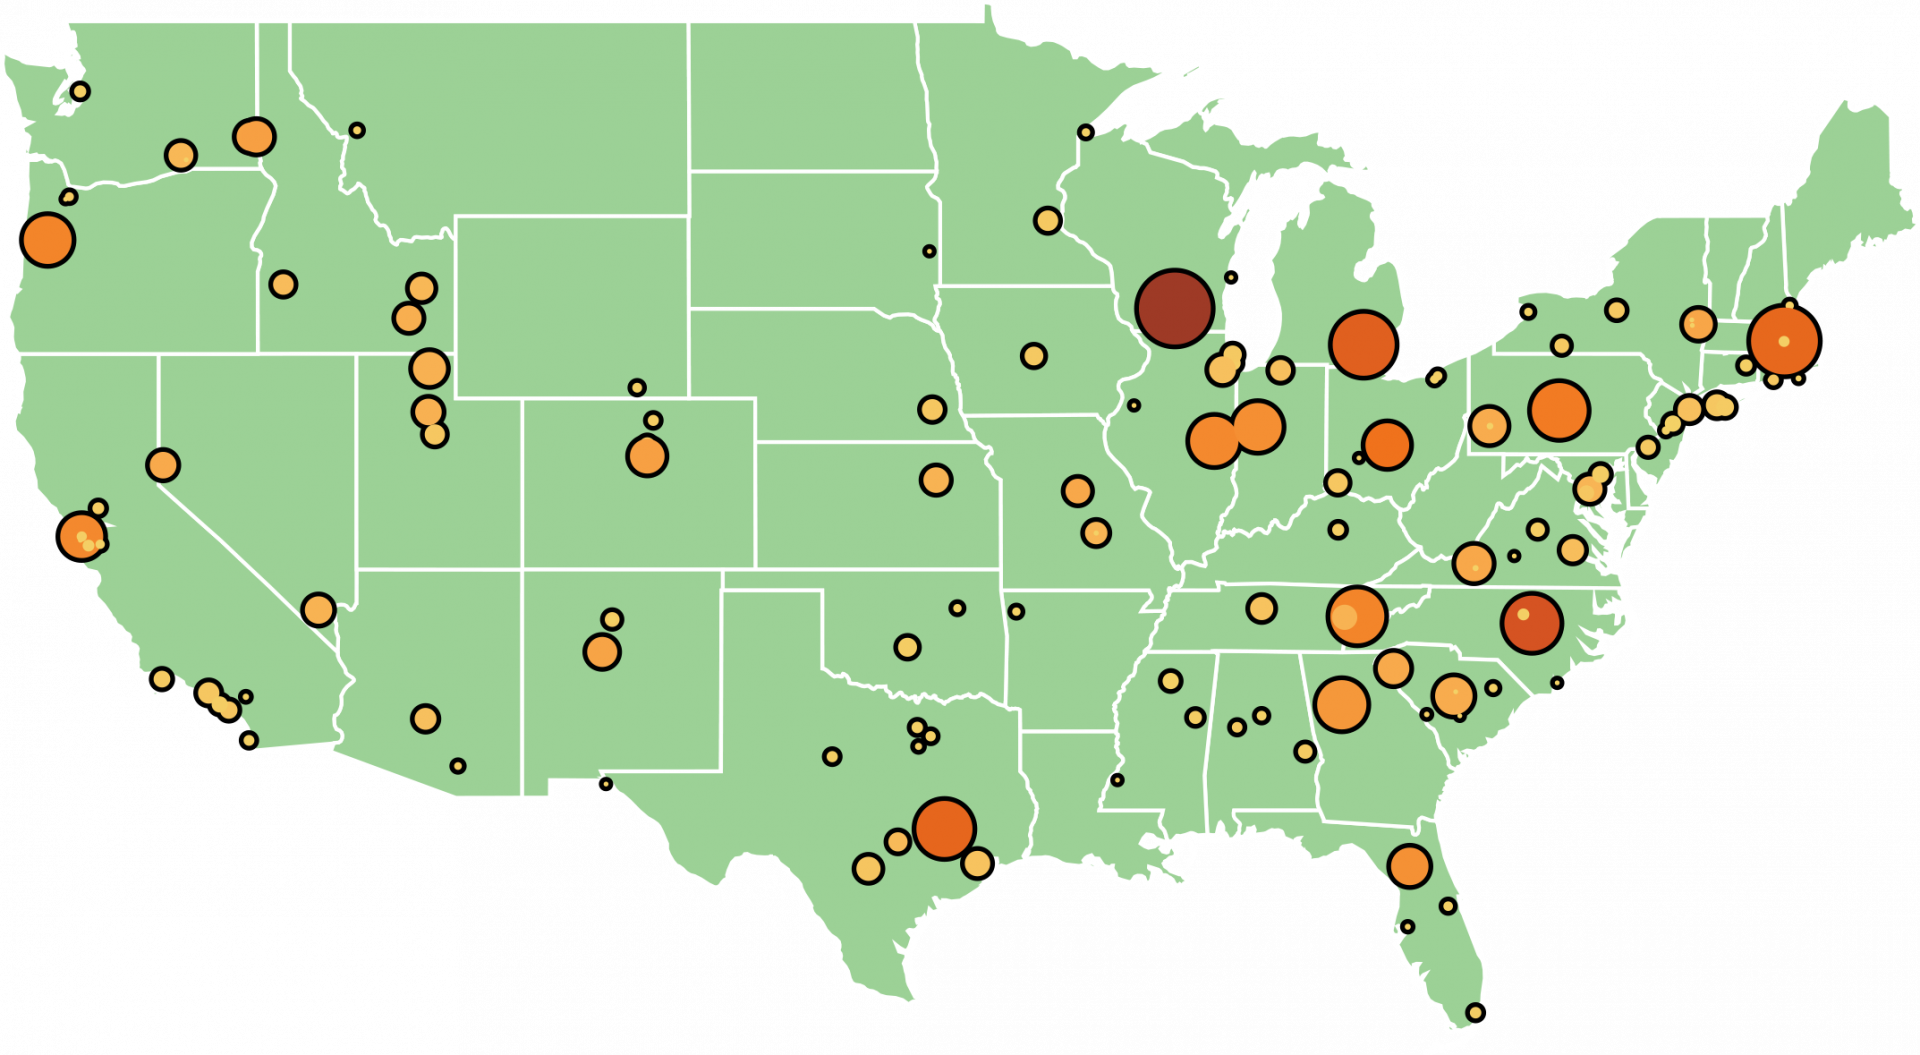
Fig. 4. Institutional funding breakdown. This map showcases all academic organizations’ funding. Larger circles indicate increasing amounts of funding, from $123,000 to $59,374,793. Not shown is the University of Alaska–Fairbanks with one project at $800,000.
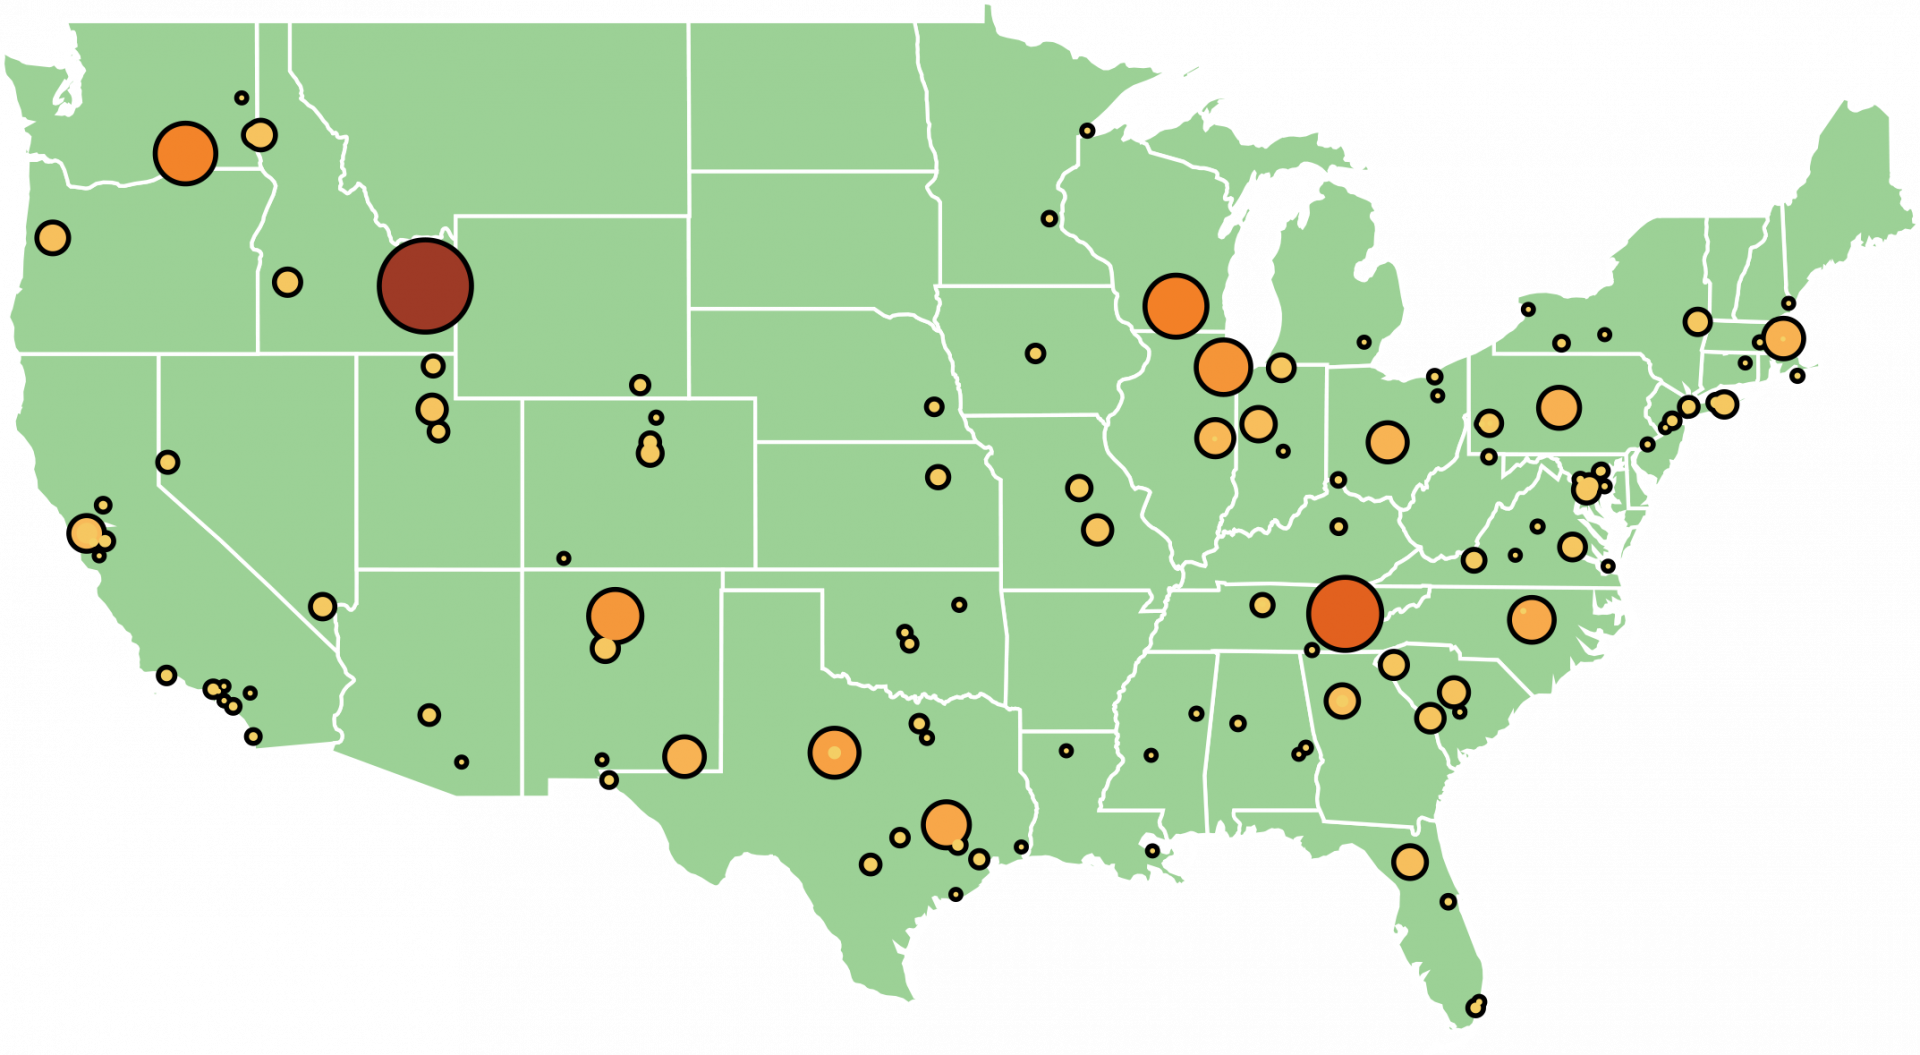
Fig. 5. Collaborative landscape. This map showcases all collaborators from academic institutions. Larger circles indicate that there were more overall collaborators from that institution, with a range of 1 to 406 collaborators. The largest circles are national laboratories, e.g., Idaho National Laboratory and Oak Ridge National Laboratory. Not shown are the University of Alaska–Fairbanks, University of Alaska–Anchorage, University of Hawaii–Hilo, and University of Puerto Rico, each with one collaborator.
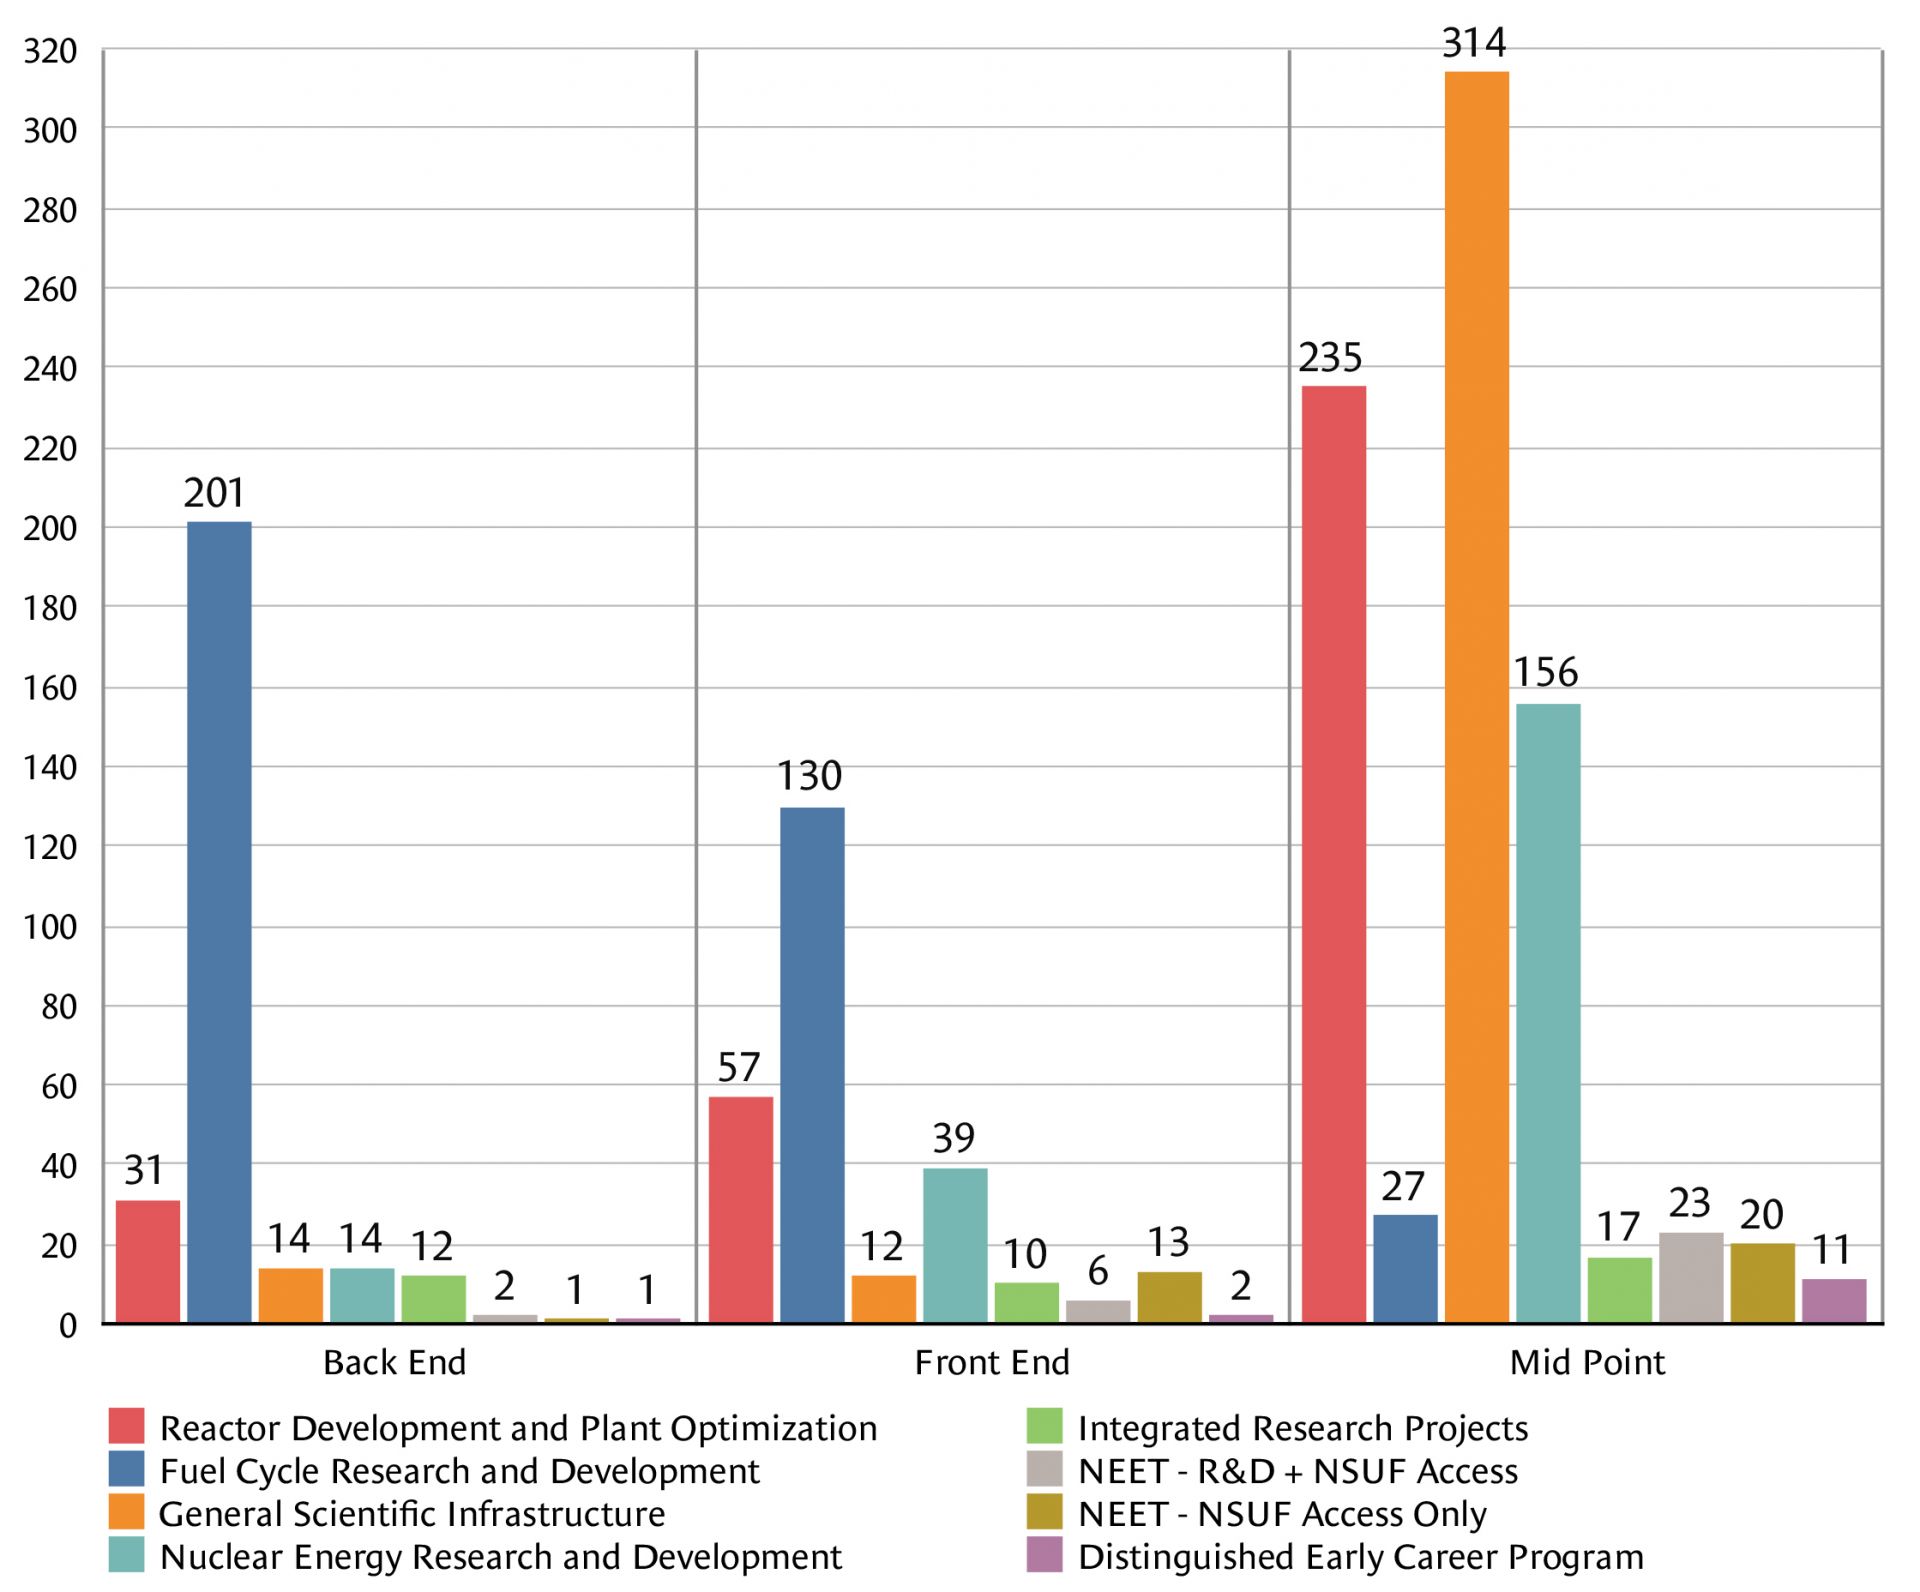
Fig. 6. NEUP project types. This bar chart showcases the total amount of projects from 2009 to 2024 and their position in the NFC. While General Scientific Infrastructure is high, most of it involves purchases, upgrades, or repairs to instruments used at academic institutions, not for any specific research project.
Fig. 7 (left): 2009–2024 count of projects. This bar chart showcases the top five universities, plus VCU, in terms of total projects funded.
Fig. 8 (right): 2009–2024 total funding. This bar chart showcases the top five universities, plus VCU, in terms of total funding.
Figure 1 compares funding allocated to key areas, including Reactor Development and Plant Optimization, Nuclear Energy Research and Development, and Fuel Cycle Research and Development each receiving its share of support. Figure 2 provides a snapshot of average funding, which gives a sense of where financial support is concentrated. Note that Integrated Research Projects, with their significantly larger funding amounts, are excluded to avoid skewing the picture. Understanding average funding levels helps identify areas of sustained interest and potential growth.
Figure 3 displays those states that are nuclear energy funding hotspots. Wisconsin, Texas, Massachusetts, and Pennsylvania lead the charge, while Puerto Rico, New Hampshire, Arizona, and Arkansas trail behind. Figure 4 showcases how funding is distributed among institutions in each state. In Fig. 5, the circles represent institutions that have collaborators (a range of 1 to 406 partners, with larger circles representing higher numbers of collaborators). National laboratories like Idaho National Laboratory and Oak Ridge National Laboratory emerge as major hubs. These partnerships are the heart of innovation, bringing together diverse expertise to tackle complex challenges.
Figure 6 plots project types defined by NEUP, categorized by NFC stage. While General Scientific Infrastructure appears dominant, most of this funding supports equipment for academic institutions rather than specific research projects. This highlights the critical role of building foundational research capacity in advancing nuclear energy.
Finally, we can see how universities stack up in the competitive landscape of nuclear energy funding in Figs. 7 and 8, which reveal the top five universities in both project count and total funding. The University of Wisconsin leads the charge with 90 funded projects, while other top universities average around 56 projects. Virginia Commonwealth University (VCU) is included for comparison, giving you a sense of their position in the landscape.
Discussion
Data from NEUP suggests that project funding is concentrated in the Midwest and along the Eastern Seaboard, particularly at established academic institutions renowned for their robust research capabilities. These institutions’ strong reputations and proven track records make them well-positioned to secure substantial grants for complex projects. Their historical presence and established foundations, as pioneers in their field, contribute to their likelihood of receiving significant funding compared to institutions developing their programs.
While established institutions’ ability to secure larger grants due to their experience with extensive projects is logical, the funding landscape highlights the challenges faced by emerging programs. Nascent programs may lack access to advanced research facilities or the necessary infrastructure to support large-scale projects, hindering their competitiveness for DOE funding. Collaboration is a crucial aspect of research projects. Partnerships can enable institutions without dedicated research infrastructure to contribute meaningfully and potentially gain recognition. However, examination of collaborator identities reveals that they are often the same significantly funded institutions. In many instances, the largest collaborators and researchers are one and the same, with federally funded national laboratories being the only entities surpassing those institutions.
To better understand the landscape of nuclear energy research, it’s essential to ask, “What types of projects are being funded?” Answering this question first requires a clear understanding of the different stages of the NFC and how they define various project types. With 1,348 funded projects to analyze, further categorization is necessary. Four major and three minor categories emerge: Fuel Cycle Research and Development (FCRD), Integrated Research Projects (IRPs), Nuclear Energy Research and Development (NERD), Reactor Development and Plant Optimization (RDPO), and the minor categories of Distinguished Early Career Awards (DECA), General Scientific Infrastructure (GSI), and Nuclear Energy Enabling Technologies (NEET). Note that the DECA program is a relatively recent initiative, established only about two years ago. These categories, while not official, provide a framework for understanding the focus areas of the funded projects.
FCRD projects aim to optimize the front end and back end of the NFC, with emphasis on fuel cladding, waste recycling, and storage.
IRPs are collaborative research initiatives tackling specific issues and knowledge gaps in nuclear energy.
NERD projects primarily involve modeling, simulation, and the development of advanced instrumentation for in situ fuel and waste monitoring.
RDPO projects focus on structural materials, reactor instrumentation, and next-generation reactor design and include social outreach and cybersecurity research.
DECA supports early-career researchers, but this category is not a primary focus of this analysis.
GSI funding largely supports academic institutions in upgrading research labs and infrastructure.
NEET projects utilize specialized Nuclear Science User Facilities (NSUF) for experimentation; funding models vary for facility access and use.
While these categories facilitate analysis, some interpretation is involved, and categorizations may evolve over time. However, the underlying funding data remain consistent.
FCRD is the most heavily funded area, with $247 million allocated to 358 projects (201 back end, 130 front end, 27 midpoint). These projects predominantly address spent nuclear fuel management and accountability, with some focus on waste recycling and monitoring. Front-end projects emphasize fuel cladding and accident tolerant fuels for future reactors. This indicates a strategic DOE focus on both back-end waste issues and front-end fuel solutions for next-generation reactor safety.
The second-most-funded area is RDPO, with $224 million supporting 323 projects (235 midpoint, 57 front end, 31 back end). RDPO projects typically involve materials testing, advanced instrumentation development, and next-generation reactor planning, with some overlap into FCRD. The midpoint focus suggests an emphasis on practical reactor operation aspects like materials testing and plant monitoring.
NERD is the third-most-funded area, with $154 million granted to 209 projects (156 midpoint, 39 front end, 14 back end). NERD projects develop new simulation and modeling codebases, underpinning innovation in the nuclear field.
Despite comprising only 39 projects, IRPs have accounted for over $140 million in spending. This highlights the value of collaborative efforts in addressing pressing knowledge gaps across the nuclear energy landscape.
While GSI has received significant funding (~$77 million) across over 340 “projects,” it’s not a “major” category as this funding primarily supports lab instrumentation upgrades rather than direct research.
The top-five-funded universities, in order, are the University of Wisconsin, Massachusetts Institute of Technology, University of Michigan, Texas A&M University, and North Carolina State University. UW leads with 90 projects and ~$59 million in funding, focused on RDPO and FCRD. NCSU has 64 projects and ~$35 million in funding, with a stronger emphasis on NERD. UM has 56 projects and ~$44 million in funding, primarily in NERD and RDPO. Texas A&M has 52 projects and ~$36 million in funding, mirroring UW’s RDPO and FCRD focus. MIT has 51 projects but ~$51 million in funding, driven in part by leadership of five IRPs (nearly half of its total).
Conclusions
Analysis of 1,348 funded projects reveals four major categories and three minor ones. Overall, FCRD projects optimize the front end and back end of the NFC; IRPs are collaborative initiatives tackling specific issues; NERD projects involve modeling and simulation; and RDPO projects focus on materials, instrumentation, next-generation reactors, and outreach. Notably, the NEUP program has been actively exploring engagement with underrepresented groups through IRPs over the past two years. DECA supports early-career researchers, GSI funds lab upgrades, and NEET enables facility-based experimentation. FCRD is the most-funded area, emphasizing waste management and next-generation fuel safety. RDPO is the second-most-funded area, focusing on reactor operations. NERD, the third-most-funded area, develops simulation and modeling tools. IRPs are fewer in number but receive substantial funding, highlighting the value of collaboration. The top-funded universities each have their own unique research emphases.
To further foster innovation and a resilient nuclear ecosystem, there’s an opportunity to explore more equitable funding models that empower emerging institutions and bring fresh perspectives. Attracting underrepresented students to the field will be vital. While technical research is crucial, the DOE can also play a role in funding interdisciplinary collaboration and community outreach programs. These initiatives can build broader understanding and excitement for nuclear energy, ensuring its long-term benefits can be accessible to all.
Acknowledgment
This research is being performed using funding received from the DOE Office of Nuclear Energy’s Nuclear Energy University Programs.
Daniel E. Rodriguez is an undergraduate accounting and finance student pursuing a minor in nuclear engineering at Virginia Commonwealth University. Supathorn Phongikaroon is a professor and the Nuclear Engineering Program Director in VCU’s Department of Mechanical and Nuclear Engineering.